
Table of Contents
Bollinger bands are a standard tool for binary options trading. They tremendously assist traders to identify both trending and ranging markets at a glance. They are also easy to use and interpret. In this article, we will explain three strategies that anyone can apply to any given time frame, using oscillator as an additional indicator. Oscillators are helpful for binary options trading as they can indicate when the market is overbought or oversold, which can give a possible reversal sign. By combining Bollinger bands with oscillators, you can boost your binary options trading strategy and increase your success rate.
Basics of Bollinger Bands
Bollinger bands are a technical analysis tool that display a channel with a middle band, which indicates the volatility of the market. The middle band acts as a reference point for the market sentiment. If the price is above this middle band, then the market is bullish, and if it is below the band, then the market is bearish.
Usage of Oscillators
Oscillators are another technical analysis tool that can assist traders to identify market trends and signals. One of the most popular oscillators is MACD (Moving Average Convergence Divergence), which we will use in this example. MACD shows two types of signals: MACD signal and MACD trend. We only need to pay attention to the MACD signal that concur with the Bollinger band signal.
Using Bollinger bands and MACD together, we can create a binary options trading strategy that can help us gain financially from market fluctuations. Binary options are a type of financial instrument that allow traders to bet on the direction of the price movement of an asset, such as forex, stocks, commodities, etc. Binary options trading is a simple and quick way to make money online, but it also involves high risks and ask for careful analysis and planning.
1. Bullish Breakout
In binary options trading, a bullish breakout is recognized when the market price, represented as a candlestick or bar, closes above the upper Bollinger band on the chart. This occurrence acts as a signal to place a call order or buy order. The trading duration will vary based on the chosen time frame for analysis using technical indicators like MACD and oscillators.
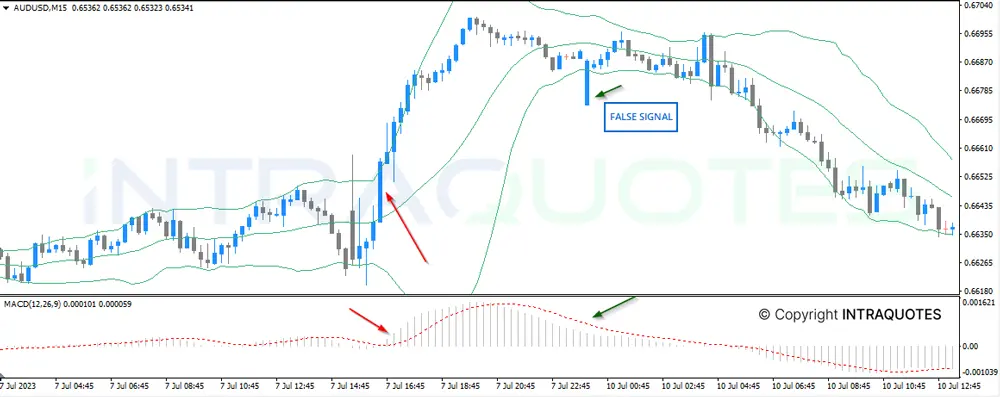
To illustrate, consider the example of AUDUSD (Australian Dollar/US Dollar) on 15 minutes chart. The Bollinger band displays a bullish breakout signal, complemented by a bullish signal from the MACD.
As long as candlesticks consistently close above the upper Bollinger band, the market indicates a bullish trend. However, a weakening in the bullish trend is indicated when the bar closes below the upper Bollinger band and the MACD displays a bearish signal. Utilizing such technical analysis can help refine and optimize a binary options trading strategy.
Quick Tip:
MACD can filter many false signals as shown in the picture, where Japanese candlesticks closed below Bollinger upper band but MACD was still bullish.
2. Bearish Breakout
In binary options trading, a bearish breakout is identified when the market price, represented as a candlestick or bar, closes below the lower Bollinger band on the chart. This occurrence serves as a signal to place a put order or fall order. The trading duration will vary depending on the chosen time frame for analysis using technical indicators like MACD and oscillators.
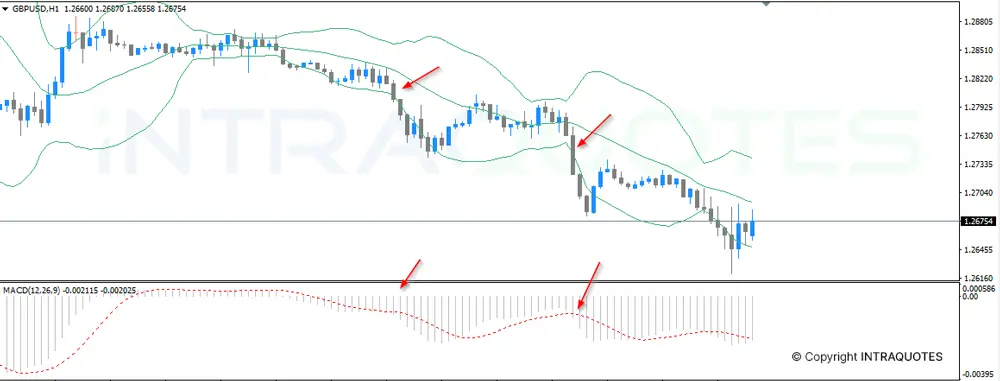
To illustrate, consider the example of the GBPUSD (Pound/US Dollar) of hourly chart. The Bollinger band displays a bullish breakout signal, complemented by a bullish signal from the MACD.
3. Range Market
In binary options trading, a range market is identified when the market price, represented as a candlestick or bar, stays inside both the upper and lower Bollinger band and the band channel keeps squeezing on the chart. This occurrence signals to place a stay-in-range order within a selected time range.
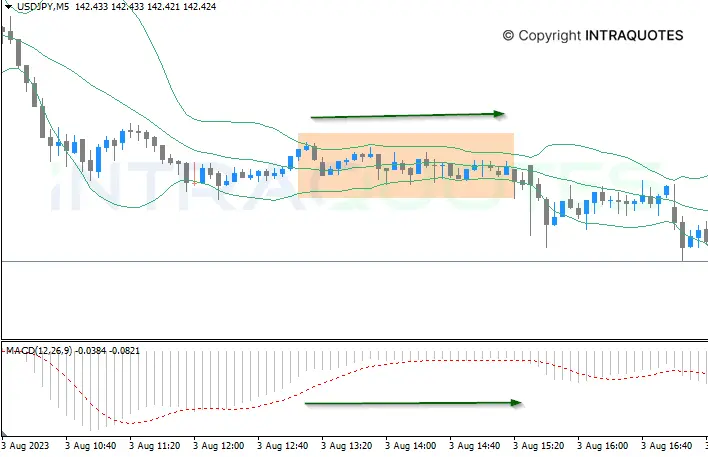
To illustrate, consider the example of USDJPY (US Dollar/Yen) of 5 minutes chart. The Bollinger band displays a range market, complemented by a no-trend signal from the MACD. At this point, stays binary order has a better chance to win.

Trade the above strategy with Deriv
Get Free Crypto E-Book
Disclaimer: Deriv offers complex derivatives, such as options and contracts for difference (“CFDs”). These products may not be suitable for all clients, and trading them puts you at risk. Please make sure that you understand the following risks before trading Deriv products: a) you may lose some or all of the money you invest in the trade, b) if your trade involves currency conversion, exchange rates will affect your profit and loss. You should never trade with borrowed money or with money that you cannot afford to lose.