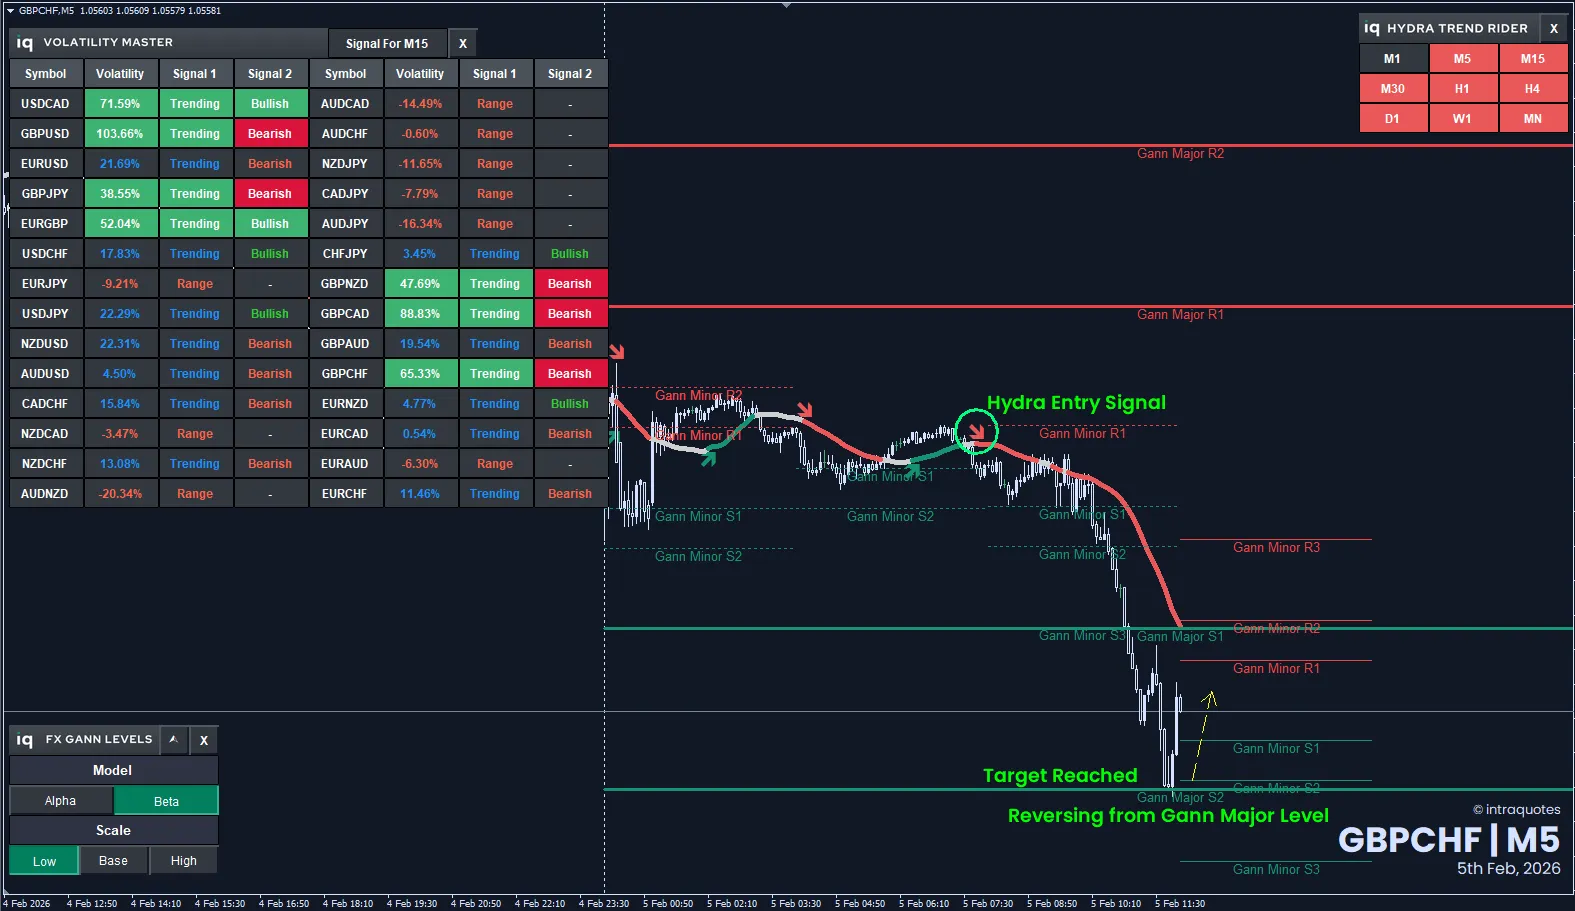
Today’s GBPCHF M5 session delivered a textbook example of how Gann Square of 9 support and resistance levels continue to perform with precision in modern Forex markets.
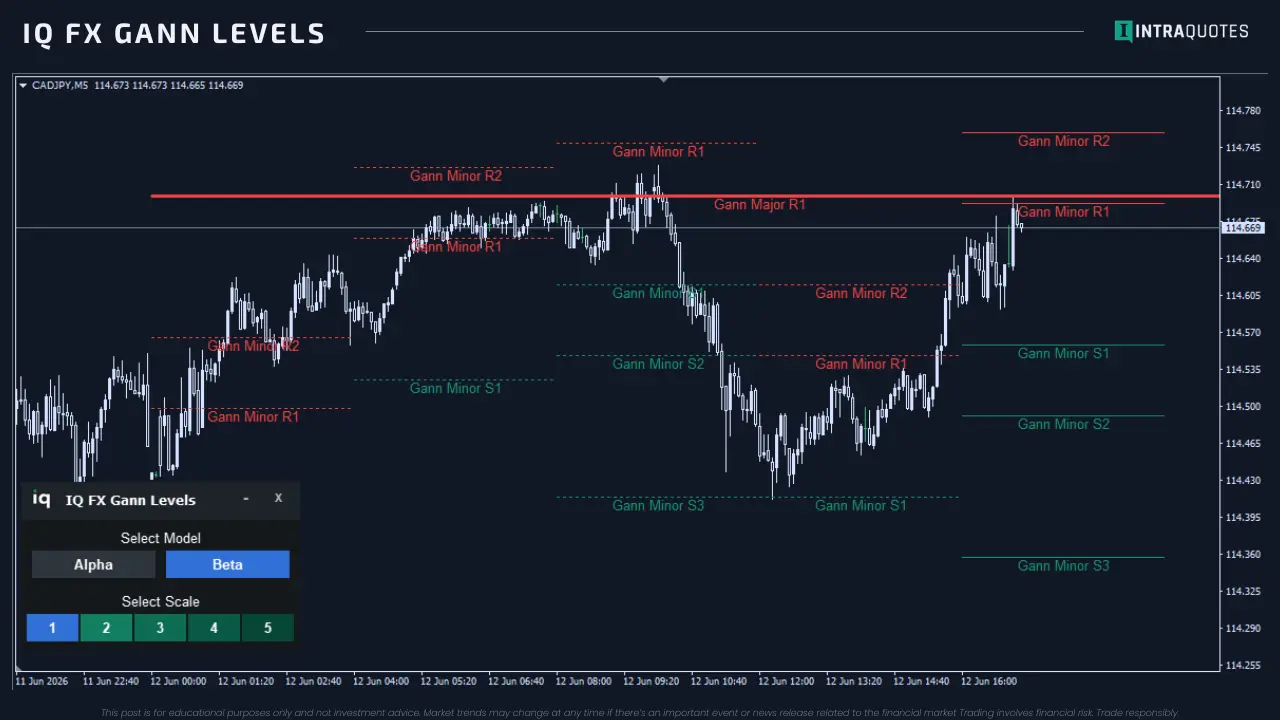
Using IQ FX Gann Levels, key price zones were mathematically projected in advance, not adjusted after the price reacted.
The market respected those levels with remarkable accuracy.
Why GBPCHF?
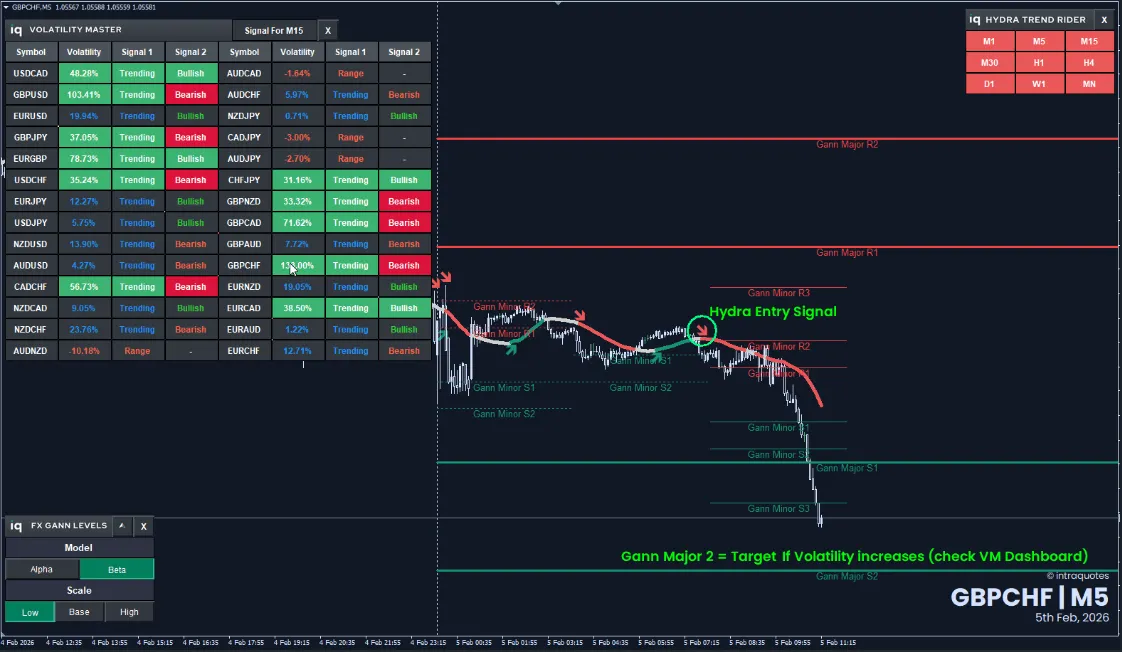
The Volatility Master Dashboard identified GBPCHF as one of the highest-volatility pairs, with volatility expanding during the session. Rising volatility typically increases the probability of clean level-to-level movement.
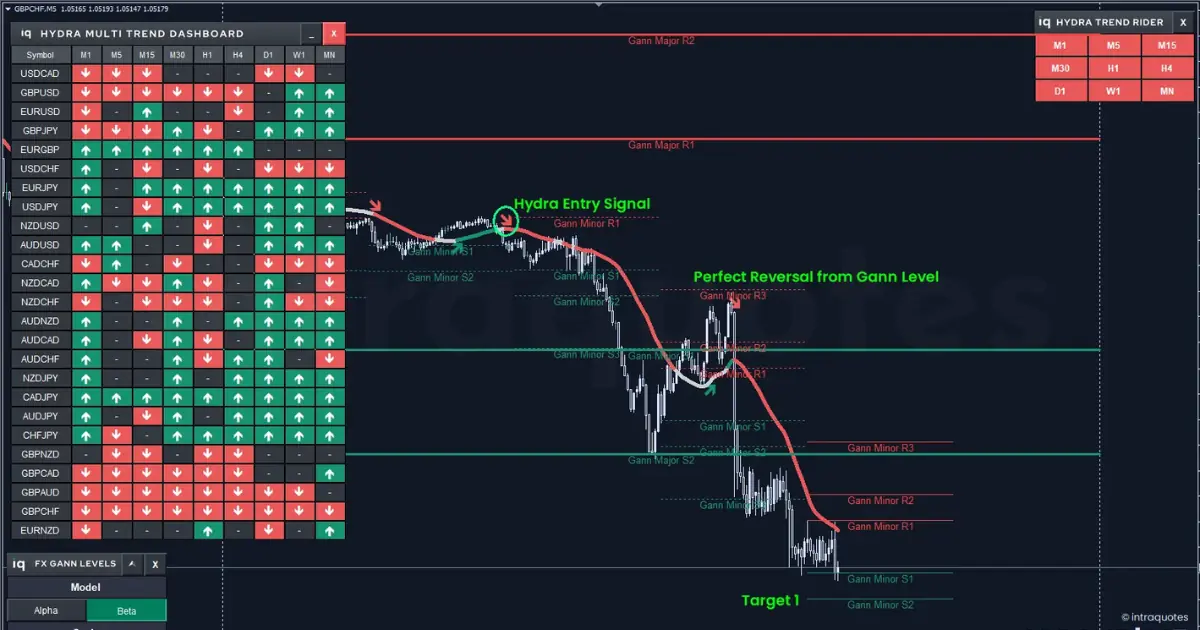
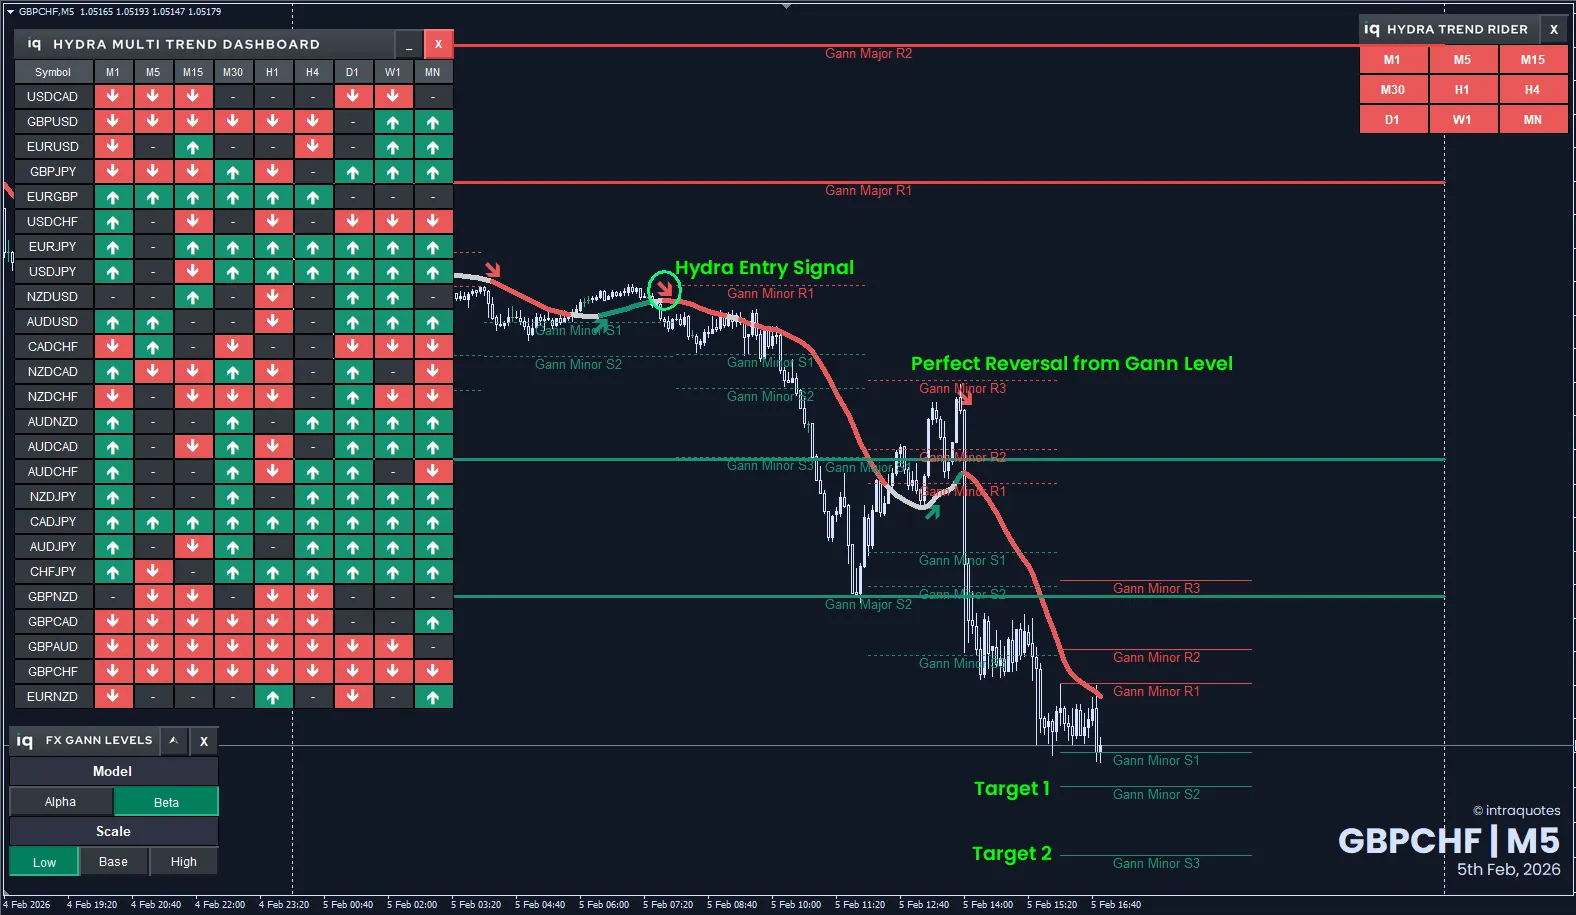
Once Hydra Trend Rider was applied, the multi-timeframe dashboard confirmed clear bearish alignment. Momentum and structure were synchronised.
To project hidden support and resistance derived from the Gann Square of 9 calculation, we applied IQ FX Gann Levels.
The result was a structured, technically clean move from resistance to downside targets.
What the Charts Revealed
Across the three chart views:
- Gann Minor R1–R3 acted as firm resistance, repeatedly rejecting the price.
- The Hydra entry aligned precisely below minor resistance.
- Price rotated downward in a smooth trend leg.
- Gann Major S1 and S2 provided downside reaction zones.
- Price respected each projected level sequentially, moving level to level.
There was no random volatility spike. The market followed projected geometry.
This behaviour reflects the core Gann principles of:
- Price vibration
- Geometric balance
- Angular structure
When volatility expands in a trending environment, projected Gann levels often act as magnetised reaction points.
Why This Matters to Professional Traders
Most retail indicators are reactive. They confirm what has already happened.
IQ FX Gann Levels projects objective levels in advance, allowing traders to anticipate:
- Potential rejection zones
- Profit-taking areas
- Structural stop placements
- Trend continuation levels
There is no repainting.
There is no hindsight adjustment.
Only a mathematically derived price structure.
Professional trading is not about prediction.
It is about positioning around the structure.
Trade Logic Summary
- Volatility expansion confirmed by the dashboard
- Multi-timeframe bearish alignment via Hydra Trend Rider
- Minor Gann resistance rejection
- Entry below resistance
- Sequential move toward Major Gann support
The market respected projected levels throughout the session.
Final Takeaway
When volatility expands and structure aligns, the Gann Square of 9 levels can guide price movement with high precision.
The edge is not speed.
The edge is knowing where the price is statistically likely to react.