Deriv Volatility Indices are the most popular synthetic indices available on Deriv MetaTrader 5 (MT5) swap-free accounts. These indices are designed to simulate market volatility while remaining completely independent of real-world market news and economic events.
Because they are synthetic instruments, external factors such as interest rate decisions, economic data, or geopolitical news have no impact on price movement. This makes Deriv Volatility Indices ideal for traders who prefer technical analysis without news-driven uncertainty.
You can start trading these indices with as little as 0.001 lot size on a $10 account, making them accessible to small accounts. However, it is strongly recommended to first practice on a demo account to understand price behavior and volatility patterns.
Key Features of Deriv Volatility Indices
- 100% synthetic and algorithm-driven
- No influence from global news or events
- Available 24×7 (including weekends)
- Suitable for scalping, intraday, and short-term trading
- Tradeable with very low minimum balance
Details of Deriv Volatility Indices
| Symbol name | Description | Vol min | Vol limit | Min spread | Effective leverage | Margin required (%) |
|---|---|---|---|---|---|---|
| Volatility 10 Index | Constant volatility of 10% with a tick every 2 seconds | 0.5 | 1100 | 0.158 | 1:5000 | 0.02% |
| Volatility 10 (1s) Index | Constant volatility of 10% with a tick every 1 second | 0.5 | 810 | 0.27 | 1:5000 | 0.02% |
| Volatility 25 Index | Constant volatility of 25% with a tick every 2 seconds | 0.5 | 1200 | 0.171 | 1:4000 | 0.03% |
| Volatility 25 (1s) Index | Constant volatility of 25% with a tick every 1 second | 0.005 | 5 | 49.83 | 1:4000 | 0.03% |
| Volatility 50 Index | Constant volatility of 50% with a tick every 2 seconds | 4 | 11000 | 0.021 | 1:2500 | 0.04% |
| Volatility 50 (1s) Index | Constant volatility of 50% with a tick every 1 second | 0.005 | 8 | 31.95 | 1:2941 | 0.03% |
| Volatility 75 Index | Constant volatility of 75% with a tick every 2 seconds | 0.001 | 35 | 12.71 | 1:1000 | 0.10% |
| Volatility 75 (1s) Index | Constant volatility of 75% with a tick every 1 second | 0.05 | 230 | 0.84 | 1:2000 | 0.05% |
| Volatility 100 Index | Constant volatility of 100% with a tick every 2 seconds | 1 | 660 | 0.20 | 1:1000 | 0.10% |
| Volatility 100 (1s) Index | Constant volatility of 100% with a tick every 1 second | 1 | 1000 | 0.24 | 1:1502 | 0.07% |
| Volatility 150 (1s) Index | Constant volatility of 150% with a tick every 1 second | 1 | 50 | 0.07 | 1:500 | 0.20% |
| Volatility 250 (1s) Index | Constant volatility of 250% with a tick every 1 second | 1 | 50 | 0.06 | 1:250 | 0.40% |
| Volatility 30 (1s) Index | Constant volatility of 30% with a tick every 1 second | 0.2 | 360 | 0.774 | 1:2000 | 0.05% |
| Volatility 15 (1s) Index | Constant volatility of 15% with a tick every 1 second | 0.2 | 300 | 0.576 | 1:3000 | 0.03% |
| Volatility 90 (1s) Index | Constant volatility of 90% with a tick every 1 second | 0.1 | 50 | 3.537 | 1:1000 | 0.10% |
Finding the Best Volatility to Trade
Although Deriv Volatility Indices are open 24×7, volatility is not uniform at all times. To trade efficiently, you must identify periods and instruments with strong, directional volatility rather than ranging conditions.
This is where a custom volatility dashboard indicator for MT5 becomes extremely useful.
Using a Volatility Dashboard on MT5
In the example below, the Volatility Master dashboard indicator is applied to an MT5 chart.
To keep the analysis clean and focused, only Deriv Volatility Indices are displayed in the Market Watch window. The indicator automatically scans and displays the first 30 symbols from the Market Watch list and shows their volatility percentage for the selected timeframe.
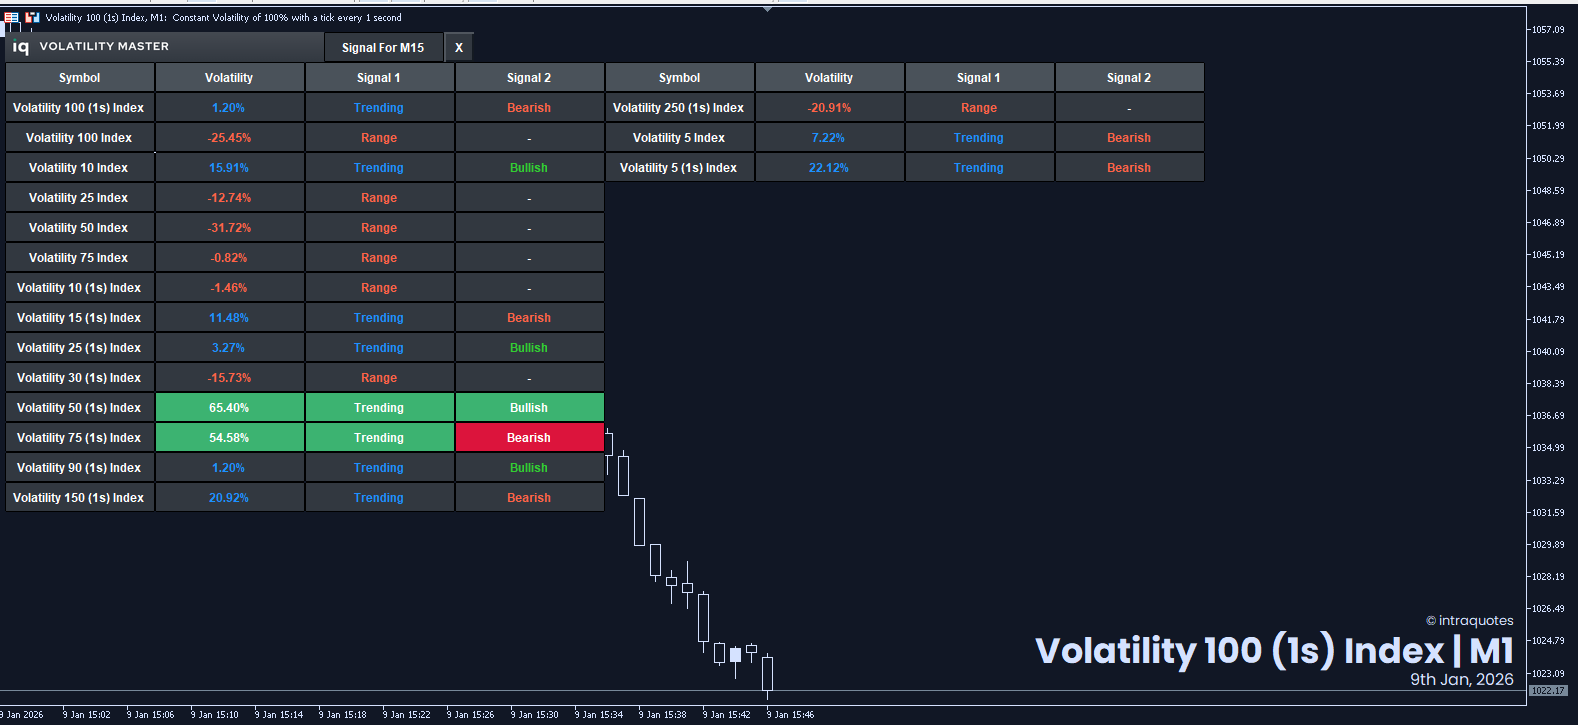
In this example:
- Timeframe used: 15-minute
- Instruments scanned: All Deriv Volatility Indices
- Output: Real-time volatility percentage
From the dashboard, we simply select the indices with high volatility readings, which significantly reduces scanning time and improves trade selection.
Selecting Tradeable Indices
From the dashboard view, Volatility 75 (1s) and Volatility 50 (1s) show volatility readings above 50%, indicating strong market movement rather than consolidation.
This suggests a clear trend environment, making these indices suitable for trend-based trading.
By clicking directly on the symbol name in the dashboard, we open the individual charts for further confirmation.
Trend Confirmation Using Multi-Timeframe Analysis
Once the chart is opened, the Hydra Trend Rider indicator is applied on the 15-minute base chart.
This indicator:
- Identifies the current trend
- Displays multi-timeframe trend alignment
- Helps confirm trade direction quickly

In the example:
- M1 to H4 timeframes show trend alignment
- For a 15-minute trading setup, checking 1-minute to 30-minute trends is sufficient
- This alignment confirms high-probability trade conditions
Trade Execution Logic
On the Volatility 75 (1s) chart, a recent red arrow signal indicates a bearish trend. Price action confirms this signal by forming lower lows and lower highs, validating downside momentum.

Risk Management Rules Used
- Stop Loss (Sell): Last two-bar high
- Stop Loss (Buy): Last two-bar low
- Take Profit: Minimum 2× stop-loss distance
- Designed to maintain a positive risk-reward ratio
Because volatility is strong and trends are clear, price respects recent swing highs and lows effectively.
Live Trade Example
(video coming up)
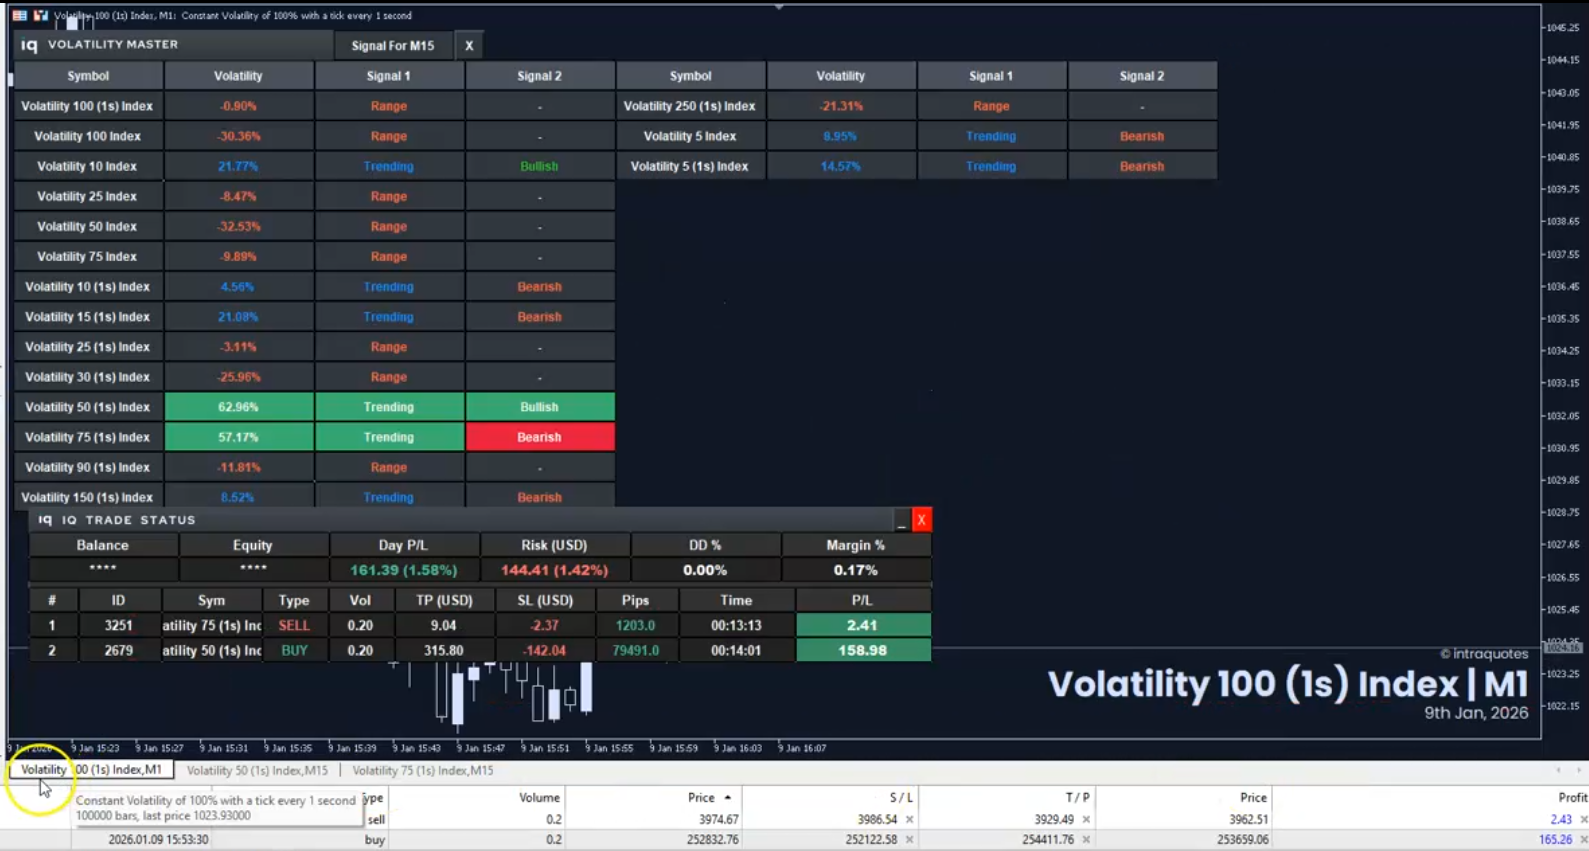
This example is provided strictly for educational purposes and is not financial advice. Always test any indicator or strategy on a demo account before applying it to live trading.
These indicators significantly reduce symbol-scanning time, improve focus, and help traders act quickly in fast-moving markets.
Final Notes
If you are trading Deriv Volatility Indices regularly, combining:
- A volatility dashboard
- A trend confirmation indicator
- Proper risk management
can greatly improve trade quality and consistency.
You can download the indicators below and begin testing them on a demo account.