Most traders focus on indicators. W.D. Gann focused on structure.
While modern markets are driven by algorithms and global liquidity, Gann believed price movements follow natural law — governed by time cycles, geometry, and mathematical proportions. His Master Mathematical Price, Time and Trend Calculator was built around one central concept: the Square of 144.
If you understand how this square works, you begin to see markets differently — not as random price fluctuations, but as movements progressing through measurable phases.
Let’s break it down clearly.
Why 144 Matters So Much
The number 12 represents time — 12 months in a year.
When you square 12, you get 144.
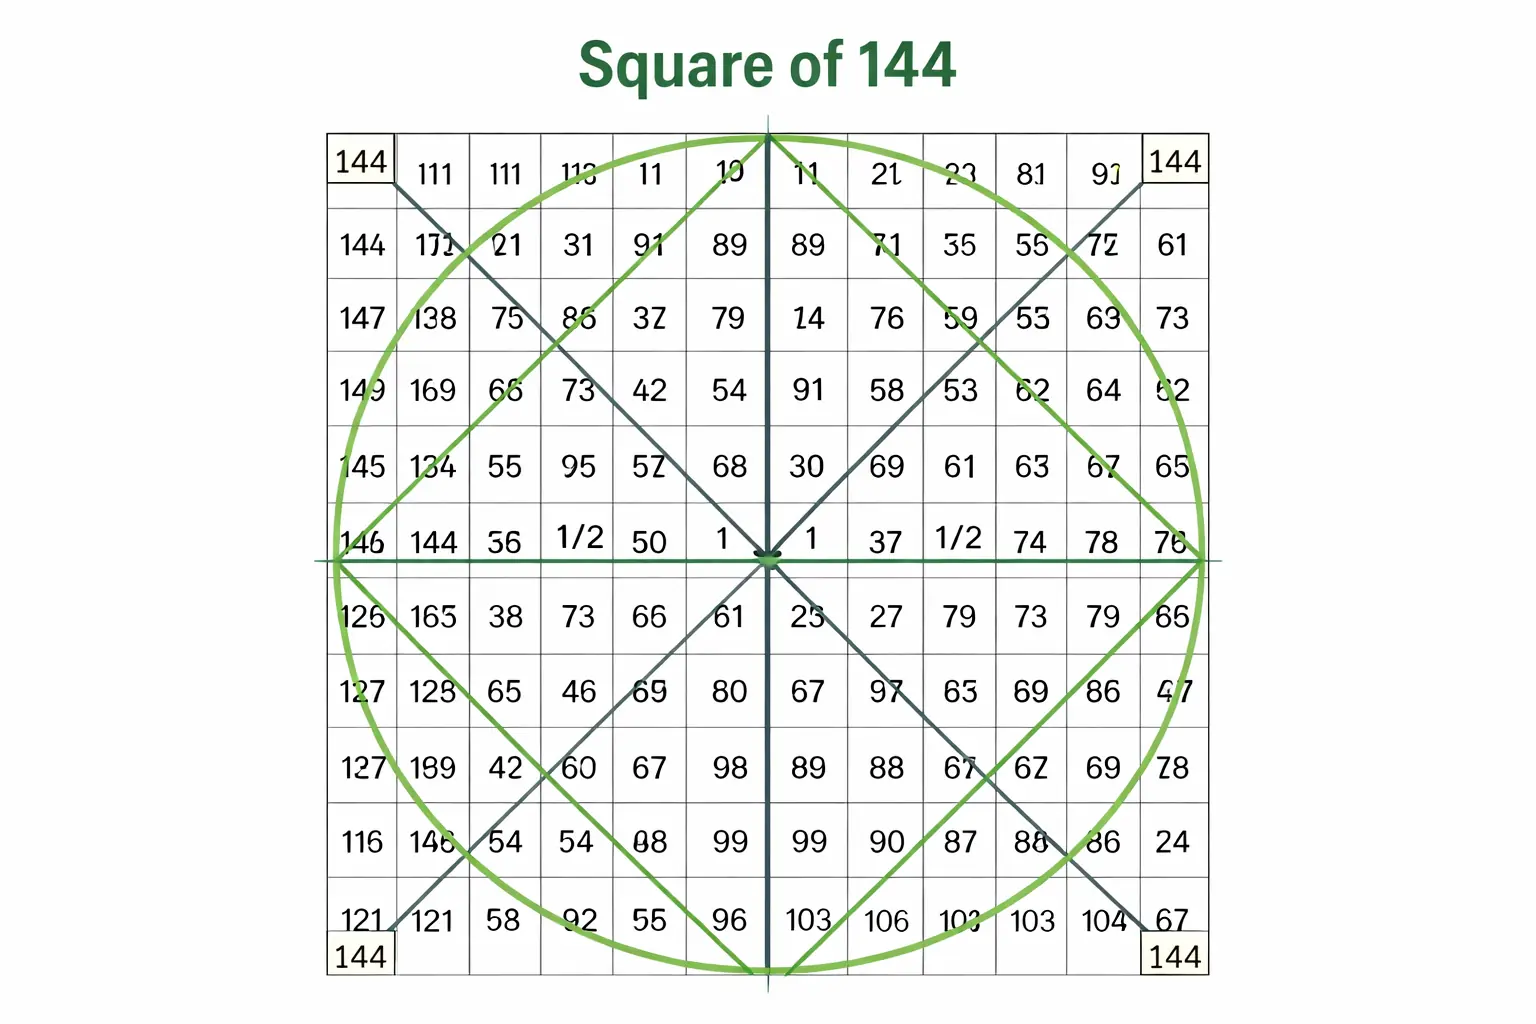
For Gann, 144 was not arbitrary. It forms a complete mathematical cycle. Inside the Square of 144 are all numbers from 1 to 144 arranged in geometric proportion. This structure allows traders to measure:
- Time cycles (days, weeks, months)
- Price ranges
- Angular resistance levels
- Natural turning points
When time and price reach proportional relationships within this square, markets often change trend.
This concept is called “squaring price and time.”
The Core Idea: Price Must Balance Time
Gann repeatedly emphasized one principle:
Time is the most important factor.
Price can move fast or slow. But when time completes a natural cycle, trend shifts often occur — especially when price has traveled a proportional distance.
For example:
- If a market rallies 36 points in 36 days, price and time are equal.
- If 72 days pass from a major low (half of 144), watch carefully.
- If 144 time units complete, expect structural change.
Markets frequently reverse at:
- 1/4 of 144
- 1/3 of 144
- 1/2 of 144
- 2/3 of 144
- 3/4 of 144
- Full 144
These fractions act as time resistance levels.
Master Numbers That Drive the Market
Gann placed strong importance on specific numbers:
- 3
- 5
- 7
- 9
- 12
These numbers repeatedly appear in time divisions, angle calculations, and resistance measurements.
For example:
- 9 is powerful because 9 × 5 = 45, linking directly to the 45° angle.
- 7 represents weekly cycles.
- 12 governs yearly and zodiac divisions.
When these numbers align with price ranges and time counts, probability increases.
This is not superstition — it is geometric proportion.
The Role of the 360° Circle
Another key foundation of Gann’s method is the 360-degree circle.
Markets move in cycles, and the circle represents completeness.
When you divide 360°:
- 180° = Half cycle
- 120° / 240° = Triangle points
- 90° / 270° = Square divisions
- 45° increments = Critical angular moves
These divisions create price resistance zones.
For example:
- A 90° move from a major high often creates resistance.
- A 180° relationship may signal trend exhaustion.
- 45° angles represent balanced trend movement.
When price breaks below a 45° angle from a major low, it often signals weakness.
When it holds above it, strength continues.
The Importance of Angles
Gann’s system is geometric.
He used angles such as:
- 1×1 (45°)
- 2×1
- 1×2
These angles measure the speed of price relative to time.
If price advances one unit per time unit, it moves along a 1×1 angle — balanced trend.
If it moves faster, the angle steepens.
If it slows, the angle flattens.
Where multiple angles cross, resistance strengthens.
The strongest reversal zones occur where:
- Angles intersect
- Price squares the range
- Time completes a fractional cycle
Halfway Points: The Hidden Pivot
Gann repeatedly stressed the importance of the halfway point.
Always measure:
- 50% of a price range
- 50% of time elapsed
- 50% between extreme highs and lows
Markets often hesitate or reverse near the midpoint before deciding their next direction.
The 72 level (half of 144) is particularly important — it represents the inner balance point of the square.
When price and time both align near this midpoint, watch for strong movement.
The Great Cycle Concept
The Square of 144 represents a complete cycle. But within it are smaller cycles:
- 36
- 72
- 108
- 144
Markets rarely reverse randomly. They reverse at proportional intervals.
For long-term analysis, 144 weeks or 144 months from a major turning point can mark structural trend shifts.
When 144 time units complete, a new square begins.
This concept is powerful for:
- Swing traders
- Position traders
- Long-cycle investors
Practical Application for Modern Traders
You do not need to physically overlay a square chart like traders did decades ago. But you must understand the relationships.
Start with this:
- Identify a major high or low.
- Count time forward: 36, 72, 108, 144 units.
- Measure the price range.
- Mark the halfway point.
- Observe if price equals time at key intervals.
If price and time align at natural fractions, prepare for a potential reversal.
Combine this with volume and structure for confirmation.
Final Thoughts
The Square of 144 is not about prediction through magic.
It is about recognizing proportion.
Markets expand and contract through cycles. Price advances along angles. Time completes measurable divisions. When these elements converge, change becomes highly probable.
Most traders look at charts.
Few measure time correctly.
When you integrate time, price, and geometry — markets stop looking random.
They start looking mathematical.