Table of Contents
IQ FX Gann Levels is a precision-built indicator based on W.D. Gann’s square-root methodologies. It plots real-time, non-repainting support and resistance levels to help traders identify accurate intraday and scalping opportunities. William Delbert Gann was a legendary analyst whose methods blended mathematics, geometry, and ancient calculation systems — many of which proved remarkably accurate in modern markets.
Indicator Download – Here
Unlike most Gann-based indicators, IQ FX Gann Levels plots future support and resistance zones and never repaints. The levels you see remain fixed, offering reliable intraday structure. These highly accurate levels allow traders to form structured day-trading plans and anticipate key market points with confidence.
This indicator is fully prop-firm ready and works extremely well paired with the Hydra Trend Rider on the same chart.
Why IQ FX Gann Levels Is Extremely Useful
- Suitable for Scalping and Intraday Trading:
The indicator continuously calculates Gann Support and Resistance using the Square-of-Nine method as the market moves. - Instant Opportunity Detection:
You get precise real-time reaction levels for cleaner entries and exits. - Minimalist & Clean Chart Design:
Levels are plotted automatically with no complicated setup. - Easy Profit Target Planning :
Major and Minor levels help you set take profits, move stop losses, and trail trades during strong trends. - Dual Models + Flexible Scaling
Choose between:
Alpha Model (Fixed) – Stable, predefined levels
Beta Model (Dynamic) – Adaptive Minor levels in volatile markets
With three scaling options — Base, Low, High — you can adjust levels for any pair or volatility environment.
Who Is This Indicator For?
Designed for intermediate intraday traders and prop-firm traders who understand price action.
Works beautifully on major and minor pairs, helping you take precise entries with low SL and high RR.
Compatible Trading Styles
- Trend following
- Breakouts
- Continuation patterns
- Trend reversals
Supported Symbols (28 Pairs)
AUDCAD, AUDCHF, AUDJPY, AUDNZD, AUDUSD
CADCHF, CADJPY, CHFJPY
EURCAD, EURCHF, EURGBP, EURJPY, EURAUD, EURNZD, EURUSD
GBPAUD, GBPCAD, GBPCHF, GBPJPY, GBPNZD, GBPUSD
NZDCAD, NZDCHF, NZDJPY, NZDUSD
USDCAD, USDCHF, USDJPY
Recommended Timeframe
This indicator performs best when used on 1-minute and 5-minute charts. For intraday scalping or precise entry points, use the 5-minute chart as your main timeframe, while the 1-minute chart helps with quick entry and exit decisions. To understand the broader market trend during different forex sessions, you can refer to the 30-minute or 1-hour charts.
If you’re unfamiliar with forex sessions, you can explore the provided article and use the free forex calculators to track the current trading session in your local time.
Indicator Settings
Colour Customisation:
- Change the Support level colour
- Change the Resistance level colour
Display Settings
- Show/Hide Minor Gann Levels (True/False)
Alert Settings
- Enable/Disable desktop alerts
- Enable/Disable mobile alerts
(You receive alerts when price touches a Major level)
Show Day Open Line
- Display the daily open to understand market bias
Dashboard Settings
Model Selection
- Alpha Model – Fixed, stable reference levels
- Beta Model – Dynamic levels that adapt instantly during volatility
Scale Selection
- Base – Standard market conditions
- Low – Tight levels for low-volatility sessions
- High – Wide levels for high-volatility or news events
Why this matters:
You are no longer stuck with a one-size-fits-all indicator.
The dashboard adjusts the entire Gann system to match current market behavior, giving you clearer decisions and more accurate timing.
Getting Started with IQ FX Gann Levels (Installation)
- Open MetaTrader → Toolbox → Market → Purchased
- Install the indicator
- Open Navigator → Market → Drag & drop onto your chart
- Follow the plotted levels for informed trading
How the Indicator Works (Quick Explanation)
Two Types of Levels
- Major Gann Levels – Ideal for intraday trading
- Minor Gann Levels – Ideal for scalping precision
Past Levels Displayed
Past Gann levels remain visible to show where the market reacted throughout the day.
Continuous Updating
All levels update in real time using advanced Gann calculations.
Confident Trading
You can estimate potential highs and lows without doing any manual Gann math.
Mobile Alert Setup
To enable mobile alerts:
- Press Ctrl + O in MetaTrader
- Open the Notifications tab
- Enter your MetaQuotes ID from the mobile app
- Test the connection
If alerts fail, reach out to our support team.
Troubleshooting
No Support or Resistance Levels Showing for the Current Day?
This issue often occurs when your MetaTrader platform hasn’t loaded the latest market data. The most common reason is a weak or unstable internet connection, which prevents the platform from updating with current price data.
How to Fix It:
- Ensure you have a stable and strong internet connection.
- Refresh or reload your charts in MetaTrader to ensure current-day data is fully downloaded.
- Once updated data is available, the Gann FX levels will automatically display the correct support and resistance levels for the current day.
Keeping your charts updated with fresh market data is essential for accurate indicator performance.
Trading With IQ FX Gann Levels
Note: In the illustrations below, any arrows shown are for demonstration purposes only and are not included in the indicator.
GBPUSD Trade Example
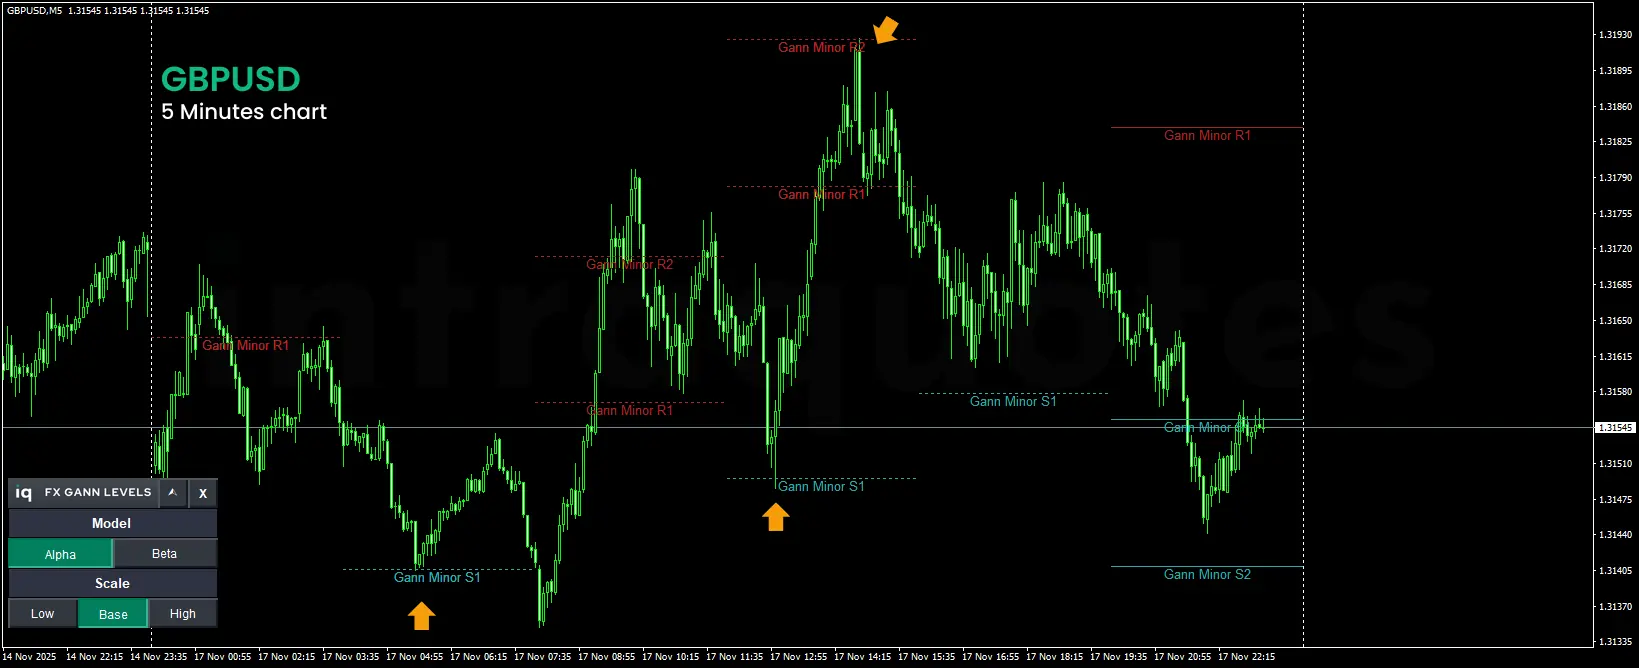
Using the IQ FX Gann Levels MetaTrader indicator, we demonstrate how accurately the market reacts to Gann levels on GBPUSD.
Notice the yellow-marked arrow areas:
- The market first reacted at Gann Minor S1, showing a sharp reversal.
- Later, it reacted again at Gann Minor S1, confirming strong support.
- The market also created the intraday high at Gann Minor R2.
In this example, we used:
- Default Scale for GBPUSD
- Default Alpha Fix mode
- Base Scale
If you observe more closely, you’ll see how price action played a major role, even without using any trend indicators.
📍 On the second touch at Gann Minor S1, a sharp pin bar formed, clearly indicating a possible reversal.
⏱ Using Smaller Timeframes (1-Minute Chart)
When applied to smaller timeframes, such as the 1-minute chart, the accuracy and clarity of the market’s reaction to Gann levels become even more precise.
In the 1-minute GBPUSD chart of the same day:
- At the yellow arrow-marked areas, the market reversed sharply from key Gann levels.
- The red long arrows indicate how price broke support/resistance levels, creating:
- Lower lows from R1
- Higher highs from S1
This helps traders better understand candlestick behavior and identify potential market reversals around these levels.

Note: Gann intraday levels are extremely powerful. The market often reacts at these levels before any trend indicator confirms signals, which is why understanding price action is essential.
CHFJPY – Trade Example
IQ FX Gann Levels are also effective in slow-moving or choppy markets such as CHFJPY.
In such markets, traders can apply a Low Scale since the pair typically moves less than 100 pips.

Key Observations:
Even at Minor Support levels, CHFJPY showed excellent accuracy.
CHFJPY tested Gann Major R2 resistance three times, each time forming a higher low, indicating bullish pressure.
Price action clearly suggested strong upward momentum before any downward correction.
Reason for sharing this example:
To demonstrate when and how to use Low Scale for low volatility markets and interpret market conditions effectively.
⚡ EURUSD – NFP (Non-Farm Payroll) News Release
During NFP, the market moves rapidly, often creating new highs and lows in a very short time.
In this scenario, we used the Beta Model, which dynamically adjusts Gann levels based on the current price.
Why use the Beta Model during NFP?
- It updates levels in real time, adjusting to fast price movements.
- Helps traders fine-tune entry and exit positions more precisely.
However, you can still trade NFP using the Alpha Model, especially if you prefer fixed levels. The Beta Model is simply an advanced option for dynamic conditions.
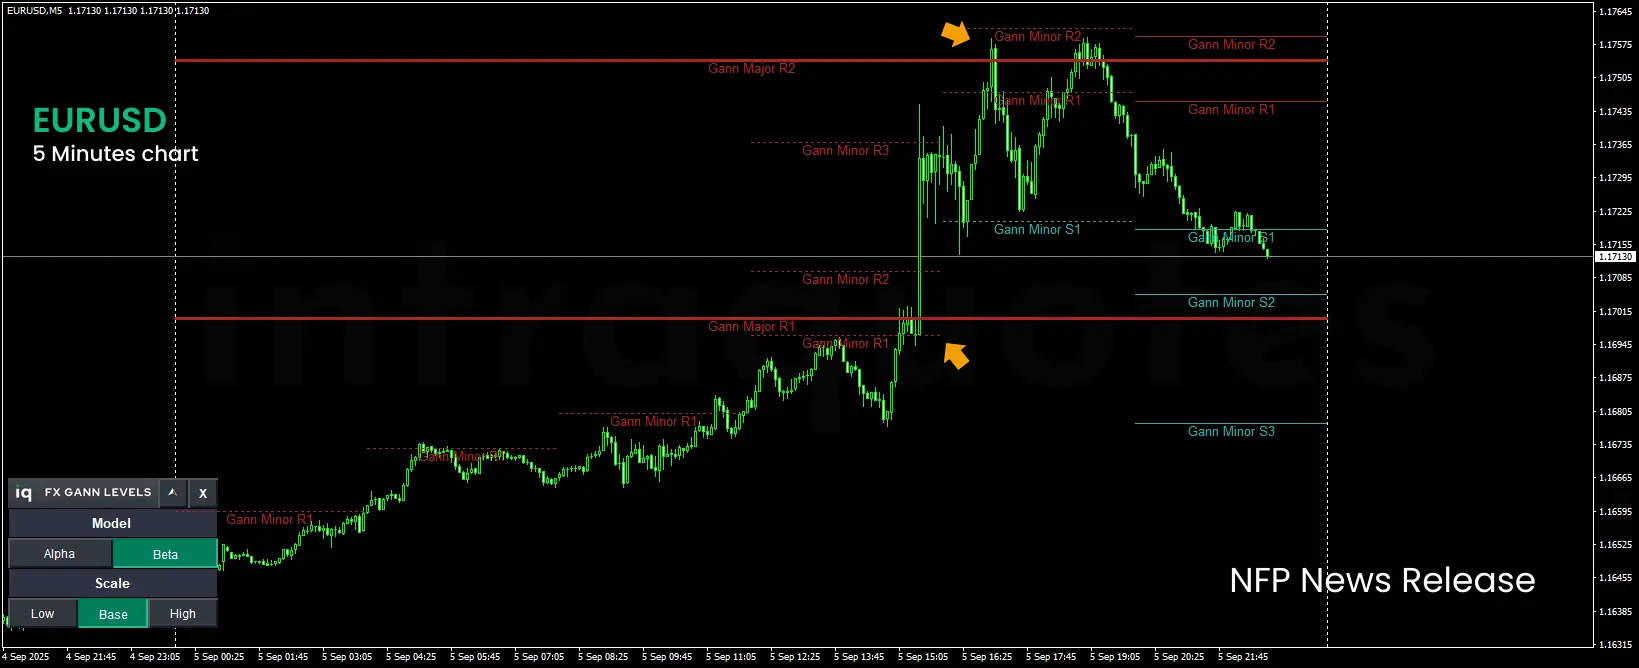
EURUSD – NFP Reaction Example (Using Gann Major Levels)
In the image above, we can clearly observe how EURUSD reacted during the NFP news release using IQ FX Gann Levels:
- The price broke above the Gann Major R1 level with strong momentum following the news announcement.
- It then rapidly moved toward the Gann Major R2 level, showing increased volatility and directional strength.
- After reaching Major R2, EURUSD tested this level twice, forming rejection wicks and hesitation candles.
- These repeated tests signaled strong resistance, which eventually led to a sharp reversal back downward.
This example demonstrates how traders can successfully use the IQ FX Gann Levels even during high-impact events like NFP, where the market moves aggressively and traditional indicators often fail to react in time.
Key Insight: During major news releases, Gann levels act as high-probability reaction zones, where price often pauses, tests, or reverses—providing valuable trade opportunities based on pure price action.
Final Notes – Alpha vs Beta Model
Comparing the IQ FX Gann Levels Alpha and Beta models for different market conditions.
| Feature | Alpha Model | Beta Model |
|---|---|---|
| Levels Type | Fixed | Dynamic |
| Best For | Regular trading sessions | High volatility (e.g. NFP, news) |
| Accuracy Style | Consistent, static zones | Real-time adaptive levels |
| User Skill Level | Beginner to Advanced | Intermediate to Advanced |
Tip: Always combine IQ FX Gann Levels with price action analysis for best results. Indicators provide key levels — but candlesticks confirm decisions.
For even better trend analysis, you can try our Hydra Trend Rider Indicator with advanced multi-timeframe dashboard and directional arrows. View more details here.
Download Indicator
IQ FX Gann Levels Indicator – View Details