Table of Contents


Tick Trade: The Rapid Path to Binary Options Gains
Discover the Tick Trading Binary Options Strategy, your shortcut to quick profits. Explore this powerful technique with simple price action and effective money management.
Binary options traders love Tick Trading for its speed. With Binary.com, you can execute 5-tick and 10-tick trades. Ticks represent the tiniest price shifts—the building blocks of market prices.
What is the Binary Options Tick Trade Rise/Fall?
Bet on market instruments rising or falling in the next 5 or 10 ticks. Tick Trade thrives with binary options volatility indexes. Here’s an illustrative example.

Master the Binary Options Tick Trade Strategy
Verified over 100 trials, this strategy boasts a high success rate. No need for indicators—just understand candlestick and wave patterns. Concentrate on continuous and reversal candlestick patterns.
Crafting the Trading Chart Setup
Time Frame: 1 Minute chart.
Instruments: All types, avoid slow market times.
Timing: Enter trades at the start of a minute bar.
Chart Wave Patterns to Follow
Higher Highs & Higher Lows:
Indicates uptrends, ideal for Rise trades.
Lower Lows & Lower Highs:
Signals downtrends, perfect for Fall trades
Real Tick Trade Example
- Instrument: Volatility 25 Index
- Duration: 5 Ticks
- Chart: 1 Minute
- Indicators: Basic price action and Japanese candlestick patterns
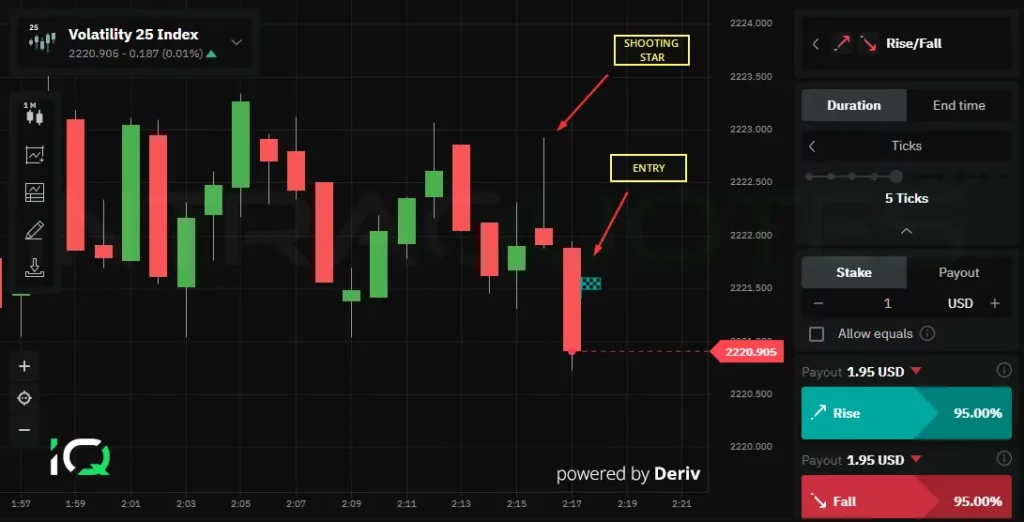
A bearish shooting star pattern formed in 1-minute chart, leading to a successful 5-tick Fall trade.
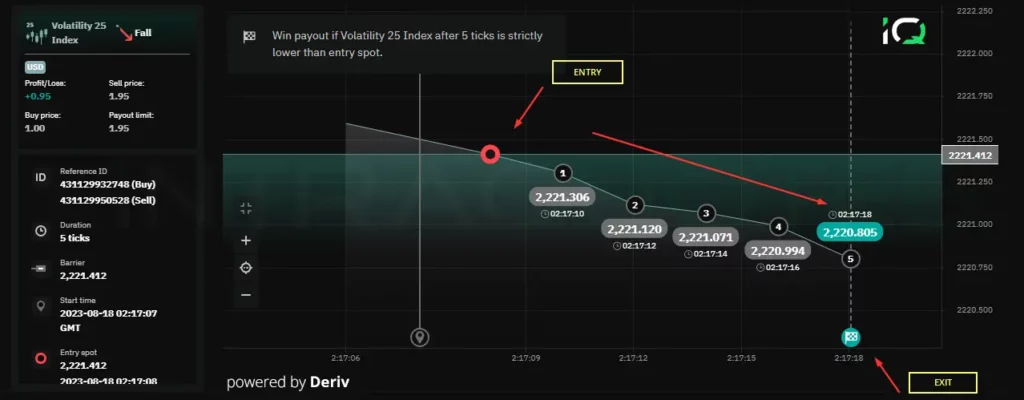
We can see that we have won the trade, and the market moved straight down.
Crucial Trading Insight
Candlestick patterns alone aren’t enough. Validate directionality. Example: a bearish pattern in a bearish downtrend is valid.
Effective Money Management
Start small with Deriv (minimum trade: 1 USD). Never over-risk. Limit exposure to 3-5% of your capital. Explore more in our comprehensive money management guide.
Quick Tip:
Learn more about effective money management strategies. Why Risk only 2%Avoid Over Trading:
One common pitfall in binary tick trading is when traders exceed their limits. Engaging in excessive trades can deplete your account within 30 minutes. However, adhering to specific rules can help you gradually grow your account over time.
After experiencing two consecutive losses, it’s advisable to halt trading and take a break.
Avoid trading the same currency pair or instrument consecutively. Opt for diversity in your trades.
Stay away from trading during slow market periods. Ignoring this guideline could result in numerous losses, given that prices tend to remain stagnant during such times.
Establish a daily trade limit; for instance, restrict yourself to 2-3 trades per day and consistently adhere to this limit.

Trade the above strategy with Deriv
Get Free Crypto E-Book
Disclaimer: Deriv offers complex derivatives, such as options and contracts for difference (“CFDs”). These products may not be suitable for all clients, and trading them puts you at risk. Please make sure that you understand the following risks before trading Deriv products: a) you may lose some or all of the money you invest in the trade, b) if your trade involves currency conversion, exchange rates will affect your profit and loss. You should never trade with borrowed money or with money that you cannot afford to lose.