Table of Contents
Traders, who are familiar with Deriv synthetic trading, would know that the Crash 500 Index moves in a specific pattern. If you open the chart, you will see a series of small bull candles followed by a long bearish candle representing the ‘crash’. In this article, we are going to cover 4 strategies to trade the Crash and Boom 500 index with Hydra Trend Rider easily.
Before that, let’s understand the basics of Deriv Crash and Boom Synthetic indexes. These indices are open 24×7 to trade. Not dependent on any market news.
Note: These are advanced strategies for intermediate traders who have basic knowledge about price action and candlesticks. If you are a beginner, we would recommend that you master those first, then come & learn these strategies to avoid any financial loss.
How does the Crash & Boom Index move?
- Crash Index: When a short bull candle appears, the market continues to move upward with small ticks and small candlestick bars, but when it falls, it crashes with a large, long bearish candle.
- Boom Index: The Boom index moves exactly the opposite of the crash index. When a short bear candle appears, the market continues to move downward with small ticks and small candlestick bars, but when it rises, it booms with a large, long bullish candle.
Utilising this movement for profitable trading
We are going to trade Deriv Multiplier with these synthetic indices.
Why Trade Multiplier?
- The multiplier trading style at Deriv enables you to trade with a controlled risk leverage of 100% to 400%.
- If you invest a $1 to $10 stake, it is recommended to use x100 leverage settings (1:100).
- The Multiplier’s benefit is that you can add take profit and stop loss as per your preference.
Steal this ‘strategy’ for a better outcome
What you need for this trade setup:
- Deriv MT5 demo account.
- Deriv Trader (DTrader) account (on the Deriv website).
- Hydra Trend Rider Metatrader indicator.
How to Start?
Step 1: Open a demo Deriv MT5 account here[hyperlink korbe]. Install MetaTrader 5 software and log in to your Deriv account on the MT5 software.
Step 2: Install Hydra Trend Rider from here. (Read the product description carefully before proceeding.)
Step 3: Log in to the Deriv website and click on ‘DT’ (Deriv Trader) to open the trading platform.
How to Set up MT5?
Once you have opened your Deriv MT5 account and logged in to your MT5 account, open Crash / Boom Index charts directly on your MT5.
- Load all timeframes (1M to Monthly) individually (by clicking on the timeframes in MetaTrader 5)
- Wait for a few minutes (depending on your internet speed) for each chart to sync to the latest data.
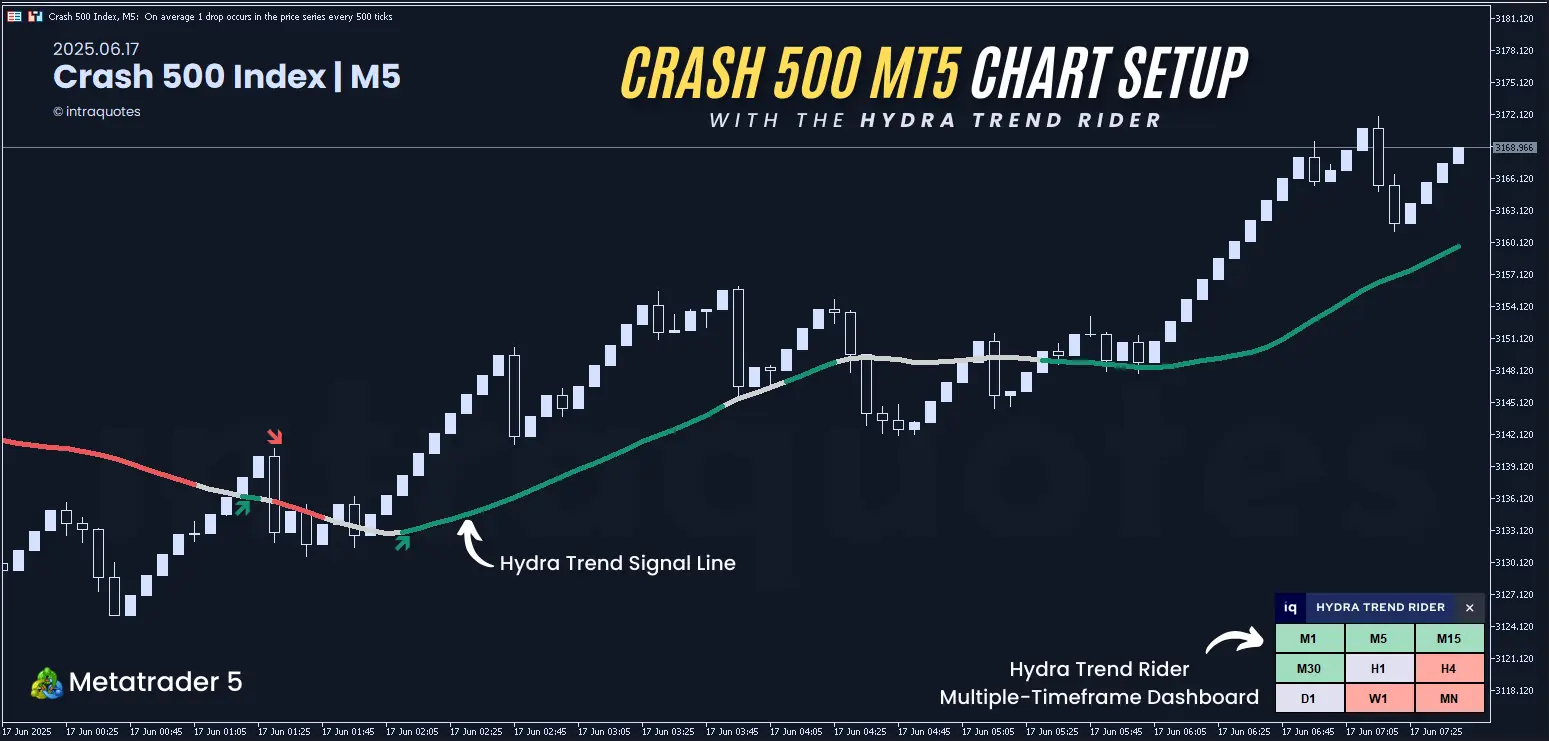
- Then add the Hydra Trend Rider indicator on the M1 chart.
How to set up DTrader?
- Open the Deriv Trader from a web browser.
- Open the same crash/boom index chart in a web browser and select the ‘multiplier’ for trading.
We will monitor the MT5 chart for a signal and execute a trade on the web browser DTrader for the multiplier. You must be thinking, “What signal?”Well, we are talking about a signal from the Hydra Trend Rider. “But what is the Hydra Trend Rider anyway? I know nothing about that!” Don’t worry, here’s a quick overview of what Hydra is and how it can help you:
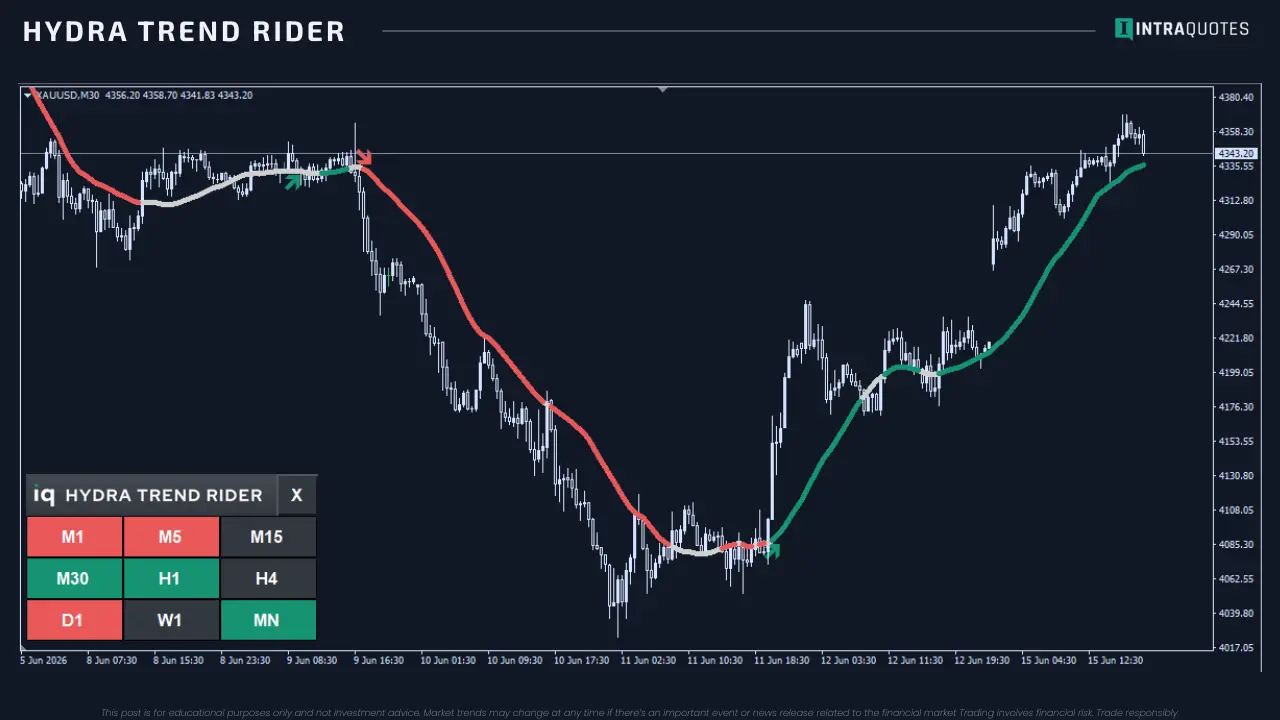
Hydra Trend Rider is an AI-powered multiple-timeframe trend signal indicator.
- It gives a Real-Time Multiple Timeframes dashboard signals – this is to confirm trend strength by analysing multiple timeframes in real-time.
- It generates ‘Entry Signals’ – Buy/Sell arrows indicate optimal trade opportunities.
- It displays trend detection through Hydra Signal Line – A colour-changing trend signal line that helps determine the trend direction for a perfect trend confirmation.
Green = bullish; Red = bearish; - It even identifies trend corrections – The Grey Hydra line and grey MTF dashboard detect price corrections, helping you save money from avoiding wrong entries, and also plan your re-entries.
Now that you have learnt everything that is needed for the trade execution, let’s jump to the strategy part straight away.
Strategy 1: Trading the Crash 500 Index with the Hydra
We will be trading those short bull candles, not the long crash candles. Our target would be to ride the trend with the Trend Rider and earn profits as long as the trend goes before the price ‘crashes’.
Risk Reward Ratio: The best you can ever have.
Criteria to meet for Buy Trade Entry:
- Only when the Hydra trend signal for the 1-minute and 5-minute charts is bullish, and in the 1-minute chart, a bullish arrow signal is formed.
- Only when the long bearish candle has been formed within the last at least 1- 8 bars.
Secret tip: When trading on a 1M chart, look for the 15M chart signal as well. If 15M displays the same signal, it is a good signal to enter a trade in a 1M chart.
Exiting the trade:
Exit when the Hydra signal on 1M is grey (or even further, M5, M15 chart signals turn grey). The grey Hydra line, along with the grey MTF dashboard signal, indicates a range market. The price enters the range market when correcting the current trend (bullish here in case ouf our example).
Risk Management:
Use lower leverage, like 100X at the beginning, to be on the safe side. If you place a trade with $10, then with 100x use a stop loss between $0.15 to $0.20. Kindly note, there is a minimum stop loss by the Deriv platform you need to follow (20%-30%). Also, your stop loss must consider the spread. You should add your stop loss + spread as the actual stop loss.
Successful Trade Example:
- Here, we entered the market when both criteria were met:
M1 to M30 Hydra Trend Rider Signal was bullish. The bullish Hydra arrow signal was displayed on the chart as well, which is an entry signal. - A crash bear candle formed within the last 7-8 candles.
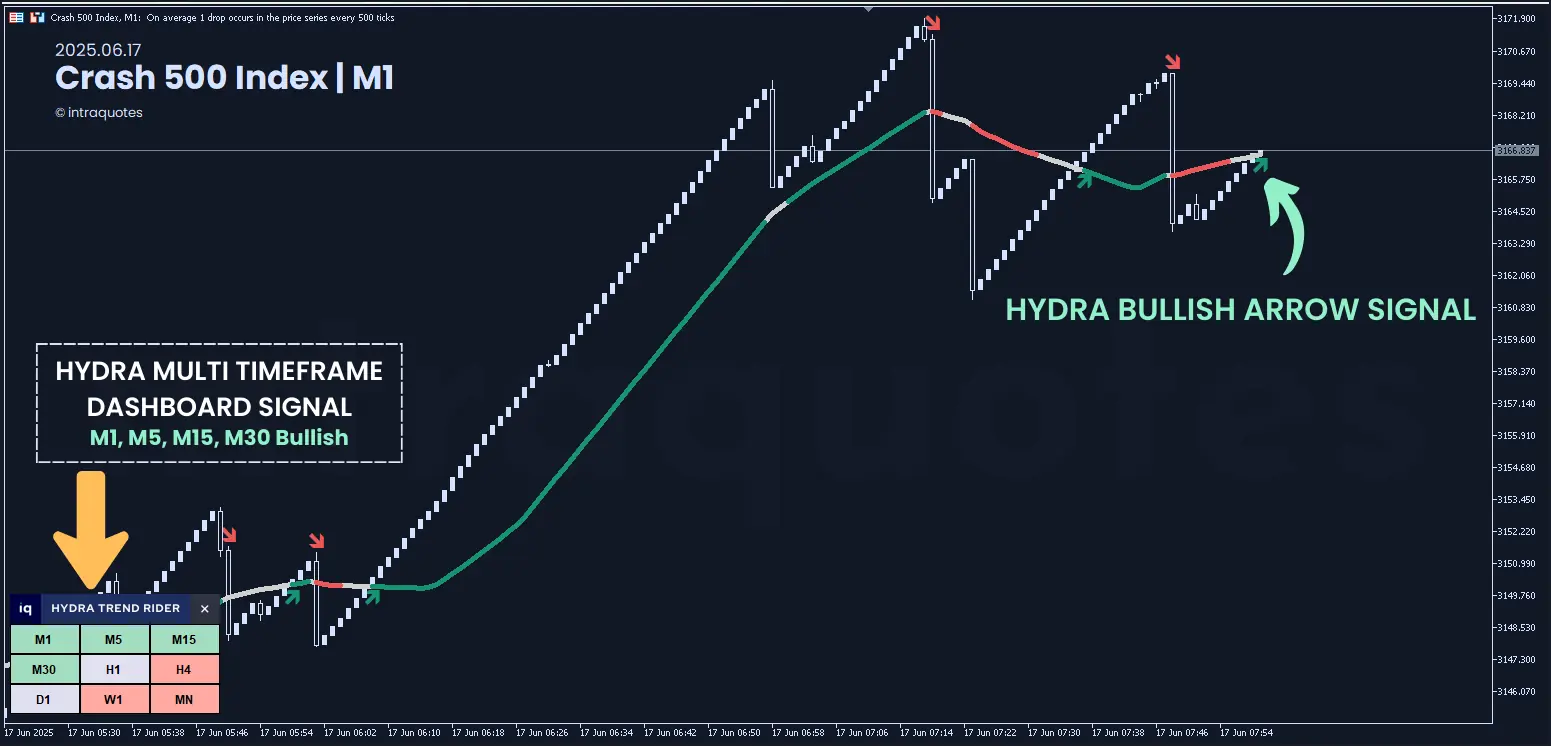
After a few bars of movement, we saw that the market was creating a symmetrical triangle chart pattern and was touching the triangle’s upper trend line. That was our cue to exit the trade. This is why trading on multipliers with the Hydra needs basic knowledge about price actions & the candlesticks.

Symmetrical triangle breakouts are often undecided; they can either make a bullish breakout or a bearish breakout. Hence, there was a high chance that it might have reversed or corrected the current bullish trend. Therefore, we decided to close our trade early with the profits we made to avoid any financial loss in the hope of more profit. That’s why knowledge of price action matters.
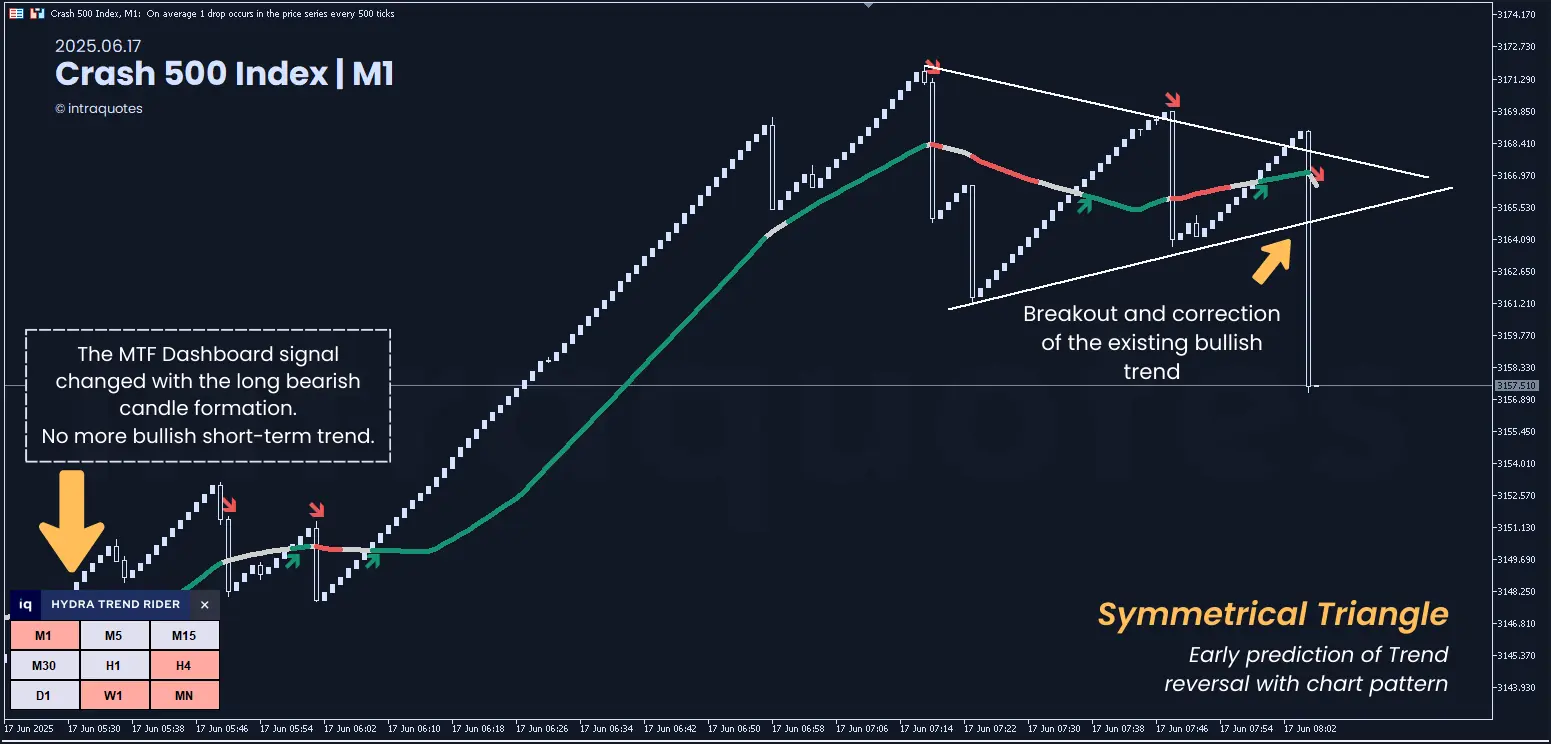
As we predicted, the price ‘crashed’ with a long bear candle soon after closing the trade. The Hydra MTF (Multi Timeframe) trend signal changed into a bearish signal and confirms the trend change.
Trade result:
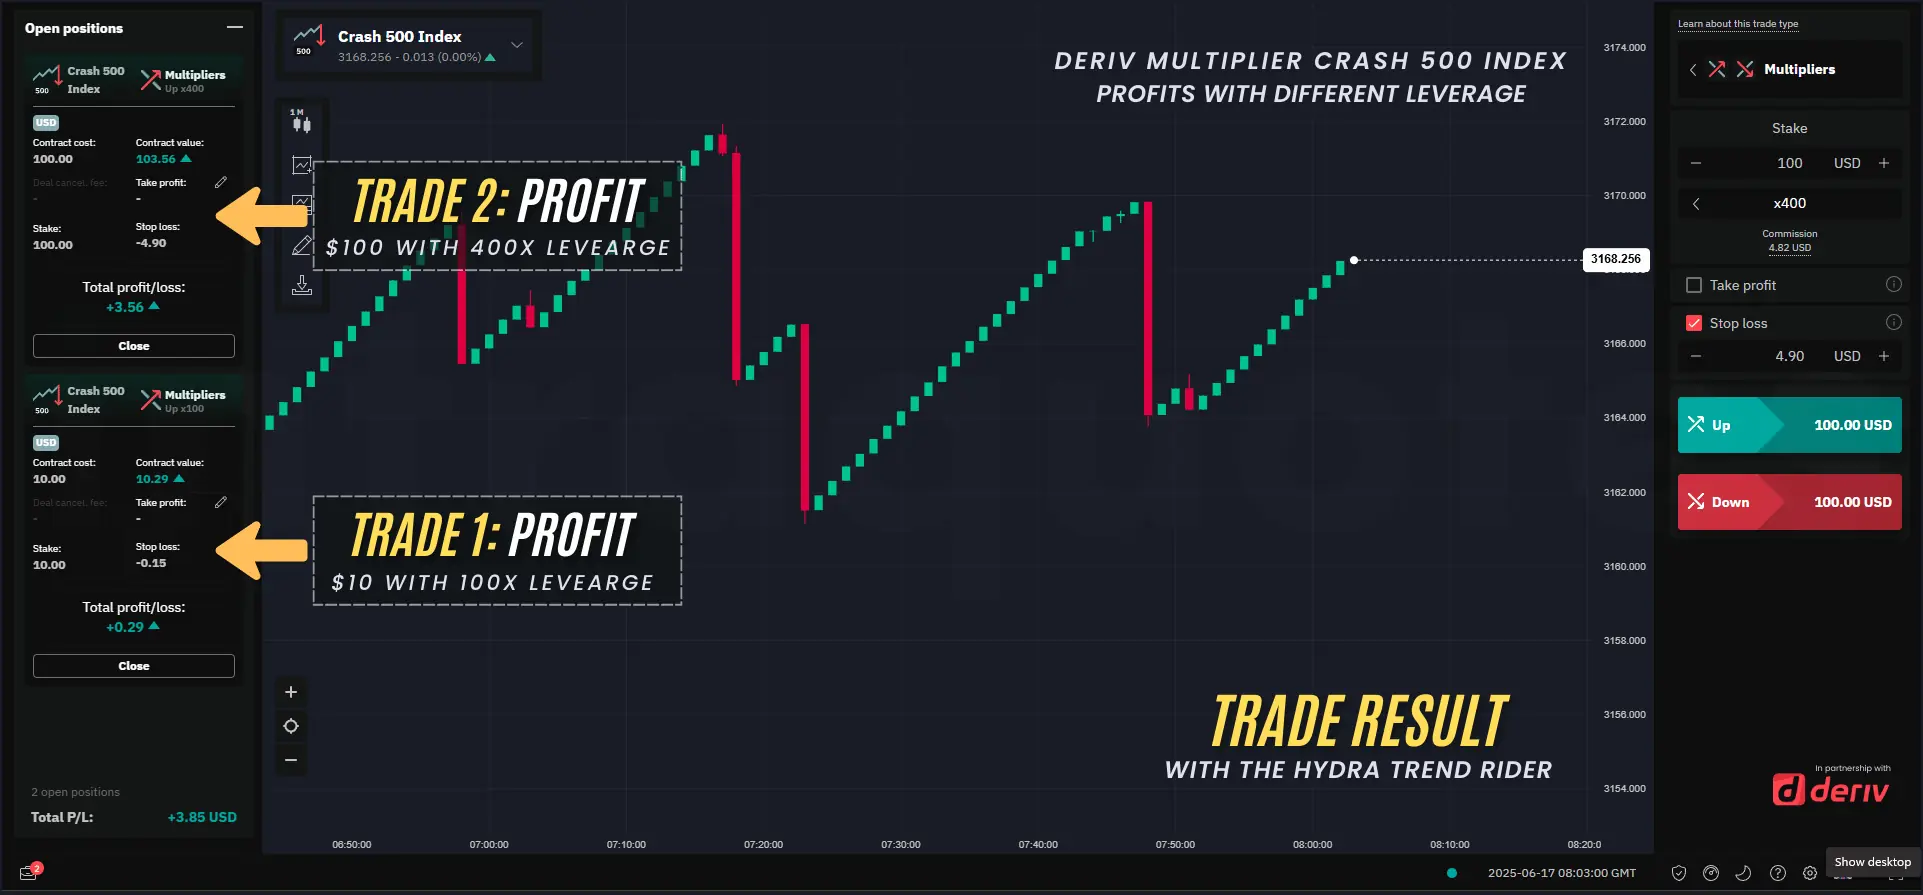
We opened two orders to analyse how much profit one can earn with different leverages, one with 100x and another with 400x on the $10 and $100 investments. We closed both the trades in profit with the Hydra Trend Rider strategy.
Bonus Tips:
From our trade example (refer to image 2), the Hydra H4, W1, MN1 trend signal was bearish from the beginning; therefore, the higher timeframe trend was already bearish to begin with. So, entering buy trade would only be a scalping opportunity, not a long-term trading opportunity. This is how the Hydra Trend Rider MTF dashboard helps you analyse the trend of multiple timeframes and trade in Deriv with confidence.
For short-term trade like this for scalping, we will recommend looking at the M1 to M15 signals. But you can even trade long term in Deriv’s other markets like Forex, Gold (real market symbols), with the Hydra Trend Rider Indicator.
Strategy 2: Trading The Boom 500 Index with Hydra
We will be trading those short bear candles, not the long boom candles. Our target would be to ride the trend with the Trend Rider and earn profits as long as the trend goes before the price ‘booms’.
Risk Reward Ratio: The best you can ever have.
Criteria to meet for Buy Trade Entry:
- Only when the Hydra trend signal for the 1-minute and 5-minute chart trend signal is bearish, along with a bearish arrow signal on the 1-minute chart.
- Only when the long bullish candle has formed within the last at least 1- 8 bars.
Exiting the trade:
Exit when the Hydra signal on 1M is grey (or even further, M5, M15 chart signals turn grey). The grey Hydra line, along with the grey MTF dashboard signal, indicates a range market. The price enters the range market when correcting the current trend (bearish here in case ouf our example).
Risk Management:
Then we can place a Multiplier sell. If you invest a $10 stake with 100X, then the minimum stop loss should be within $0.10 – $0.20, considering the spread in your calculation for stop loss.
Successful Trade Example:
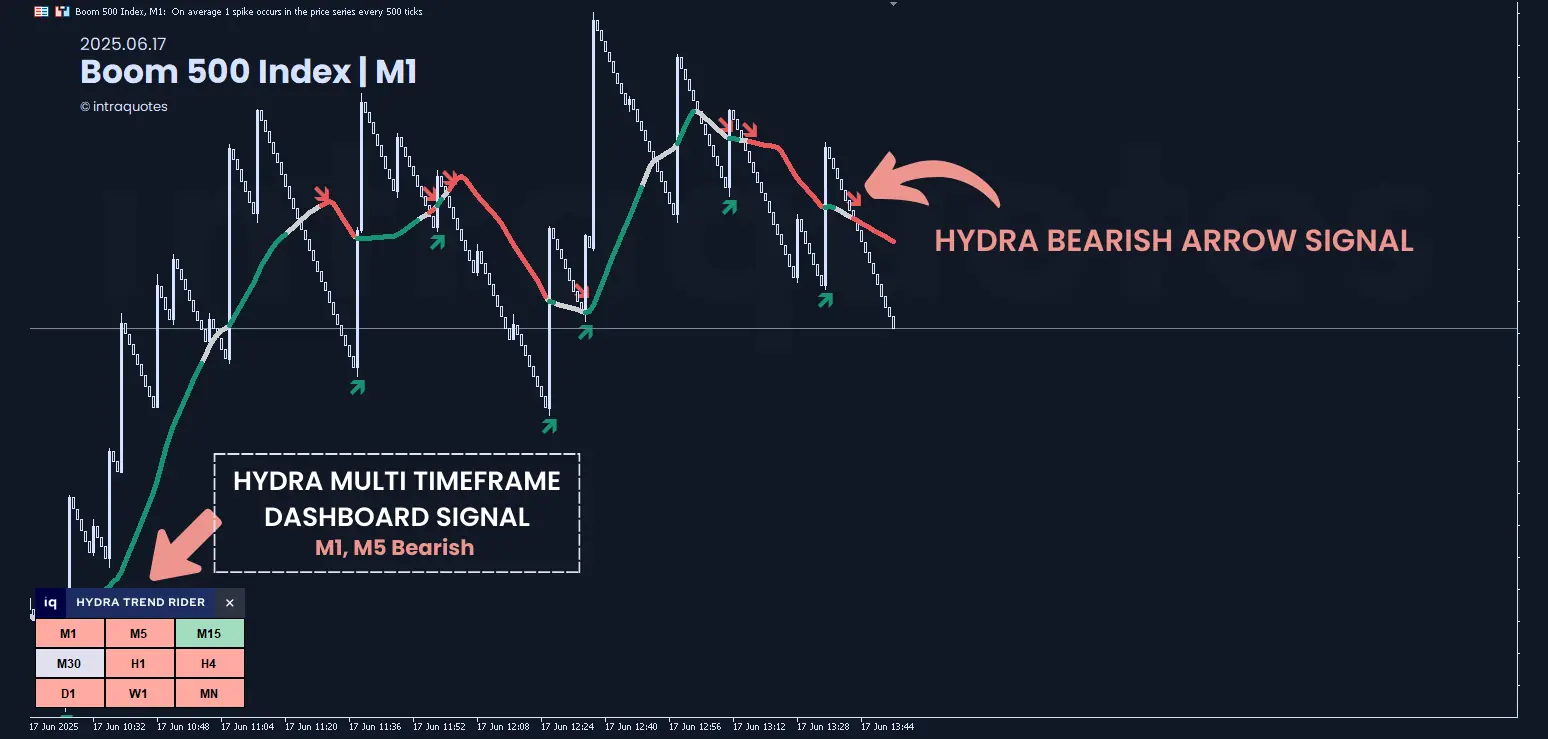
On the Deriv Boom 500 index, we can see that the Hydra Trend Rider Multiple timeframe dashboard displayed a bearish signal on both the M1 and M5 timeframes. Also, the Hydra bearish arrow was plotted on the M1 chart. All criteria met, hence we place our sell order with Deriv Multiplier.
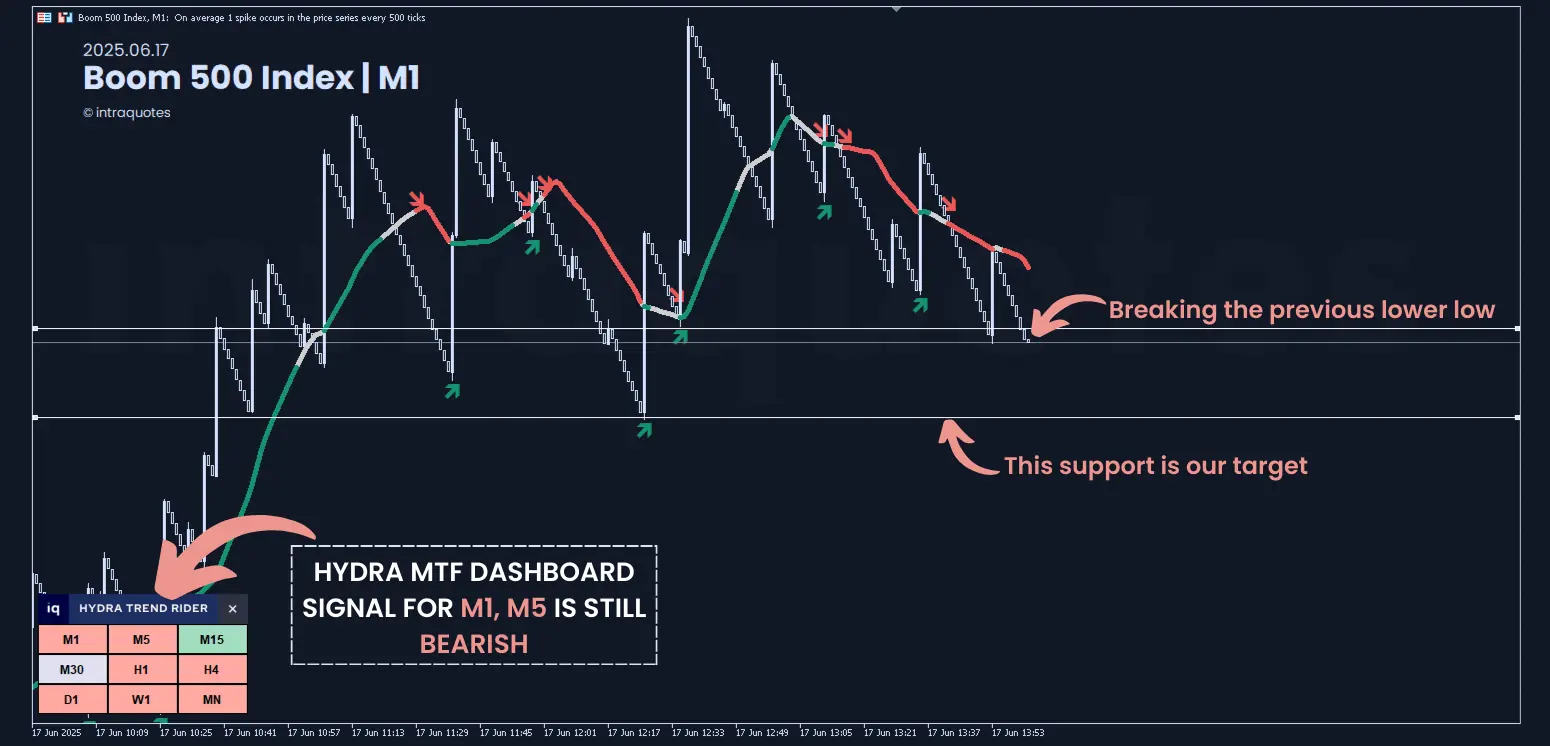
We held on to the trade for quite some time, and the Hydra MTF dashboard signal was still bearish on the M1 & M5 charts even after a sudden ‘Boom’ candle. We set our target till the next support level that was created by a long boom candle. You can set your target up to any previous lower low you feel comfortable with, as long as the Hydra signal is in your favour.
As we predicted, the price ‘boomed’ with a long bull candle soon after hitting the previous support level where we placed our target. The Hydra MTF (Multi Timeframe) trend signal changed into a bearish signal and confirms the trend change.
Trade result:
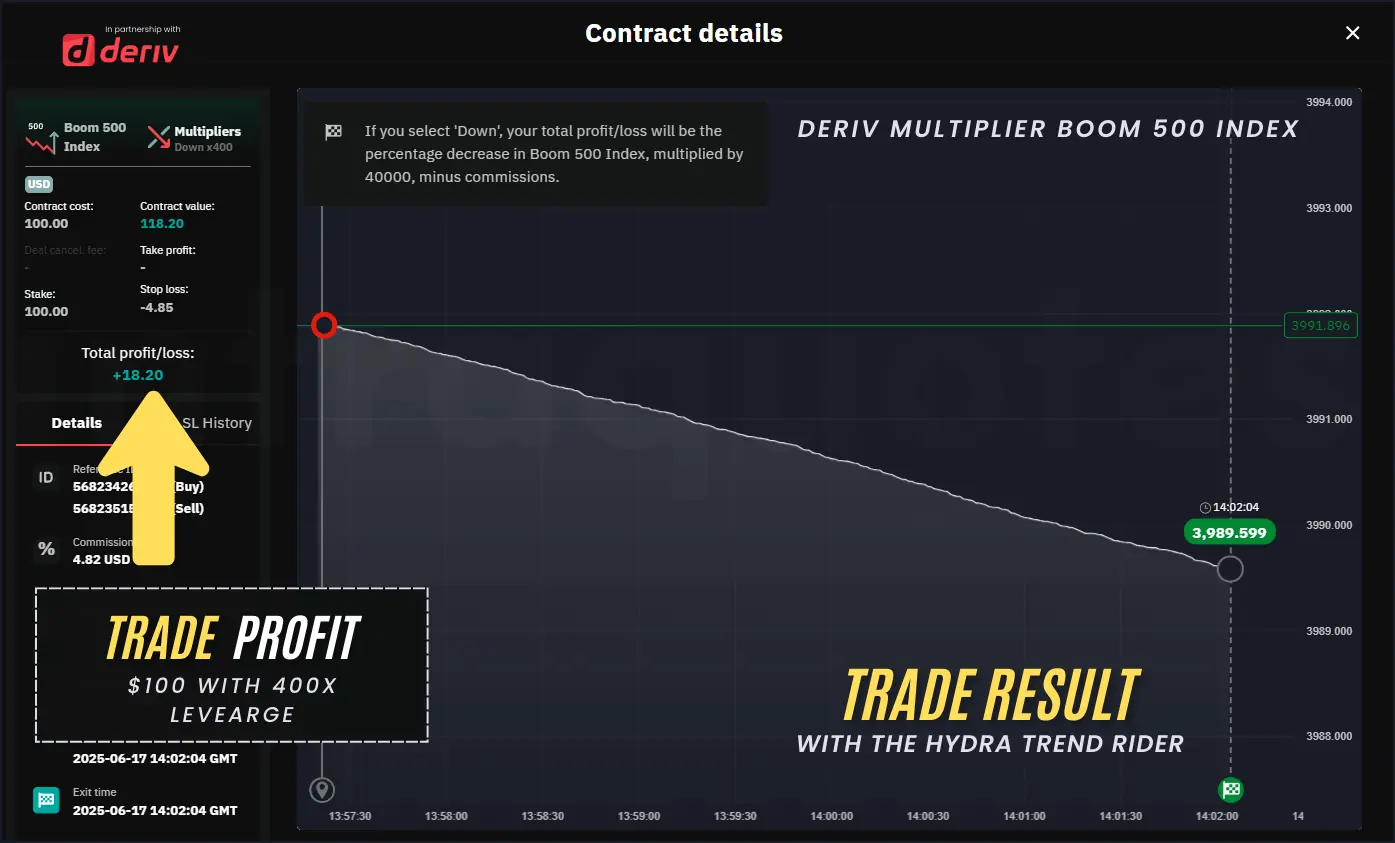
We opened with the leverage of 400x on the $100 investment. As the price was about to hit the previous support level, which was our target, we closed the trade. Yes, we closed the trade a bit early to be on the safe side and not to suffer financial loss after holding the trade for so long, just in the hope of earning a few extra cents. If we had waited for those extra cents, we could have lost our dollars of profits, because the price boomed as soon as the next candle opened at the support level exactly. Hence, we closed the trade in profit with the Hydra Trend Rider strategy.
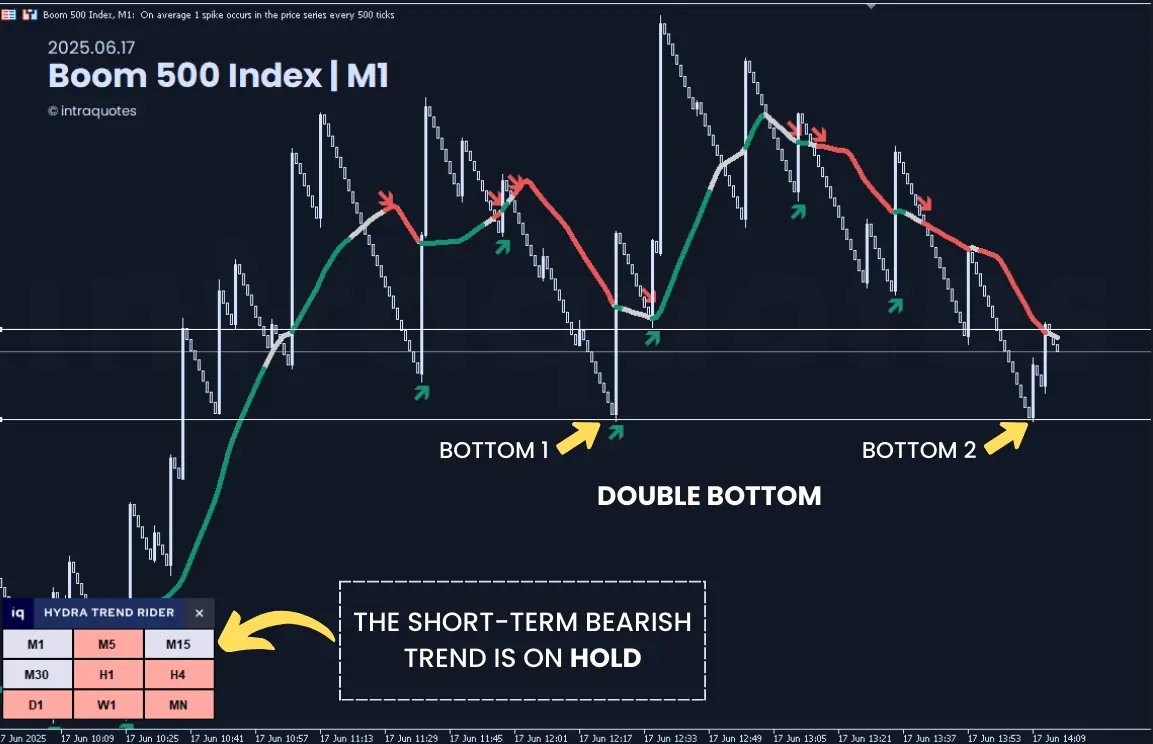
Later on, the market created a double bottom, signalling that the level was acting as a strong support, hence the price refused to go further down. That’s why our early exit from trade was a blessing. The Hydra signal line also turned grey after a double bottom formation. The Hydra MTF Dashboard signal for M1, M15 turned grey as well.
Therefore, price action aligned with the Hydra Trend signal is very useful to get an early exit/entry signal while trading with the profits you make.
Money Management Tip:
Never invest a large amount of money here. It resembles gambling since it’s a synthetic pair. Additionally, always keep your risk-reward ratio in mind while trading. With the Deriv Crash 500 / Boom 500 Index, trading 1-2 per day is enough to keep a small profit every day. If there is no signal in the Hydra, it is best to avoid trading during that time.
Small profits are always better than huge losses. If your trade gets hit by a crash candle, then you will lose a good chunk of your investment, and that will keep you in the loop to trade more to recover your losses, where you can lose even more money. Hence, follow the Hydra signal and the price action, and try to maintain a good risk-reward ratio for consistent profits.
- Here’s a risk-reward ratio calculator for a quicker calculation to save your time.
Try the Free online Risk Reward Calculator
Does Deriv Multiplier Follow your Stop-Loss?
The short answer is no. Say you set a stop-loss of 0.25 cent, and a sudden long candle forms, you will be doomed! Because it will not only hit your stop loss, but the price will go beyond your stop-loss, making you lose money more than what you have set as your stop-loss. This is because of the spread, which gets added to your stop loss. That’s why trading with low leverage is safer.
What if you want to sell your Contract early?
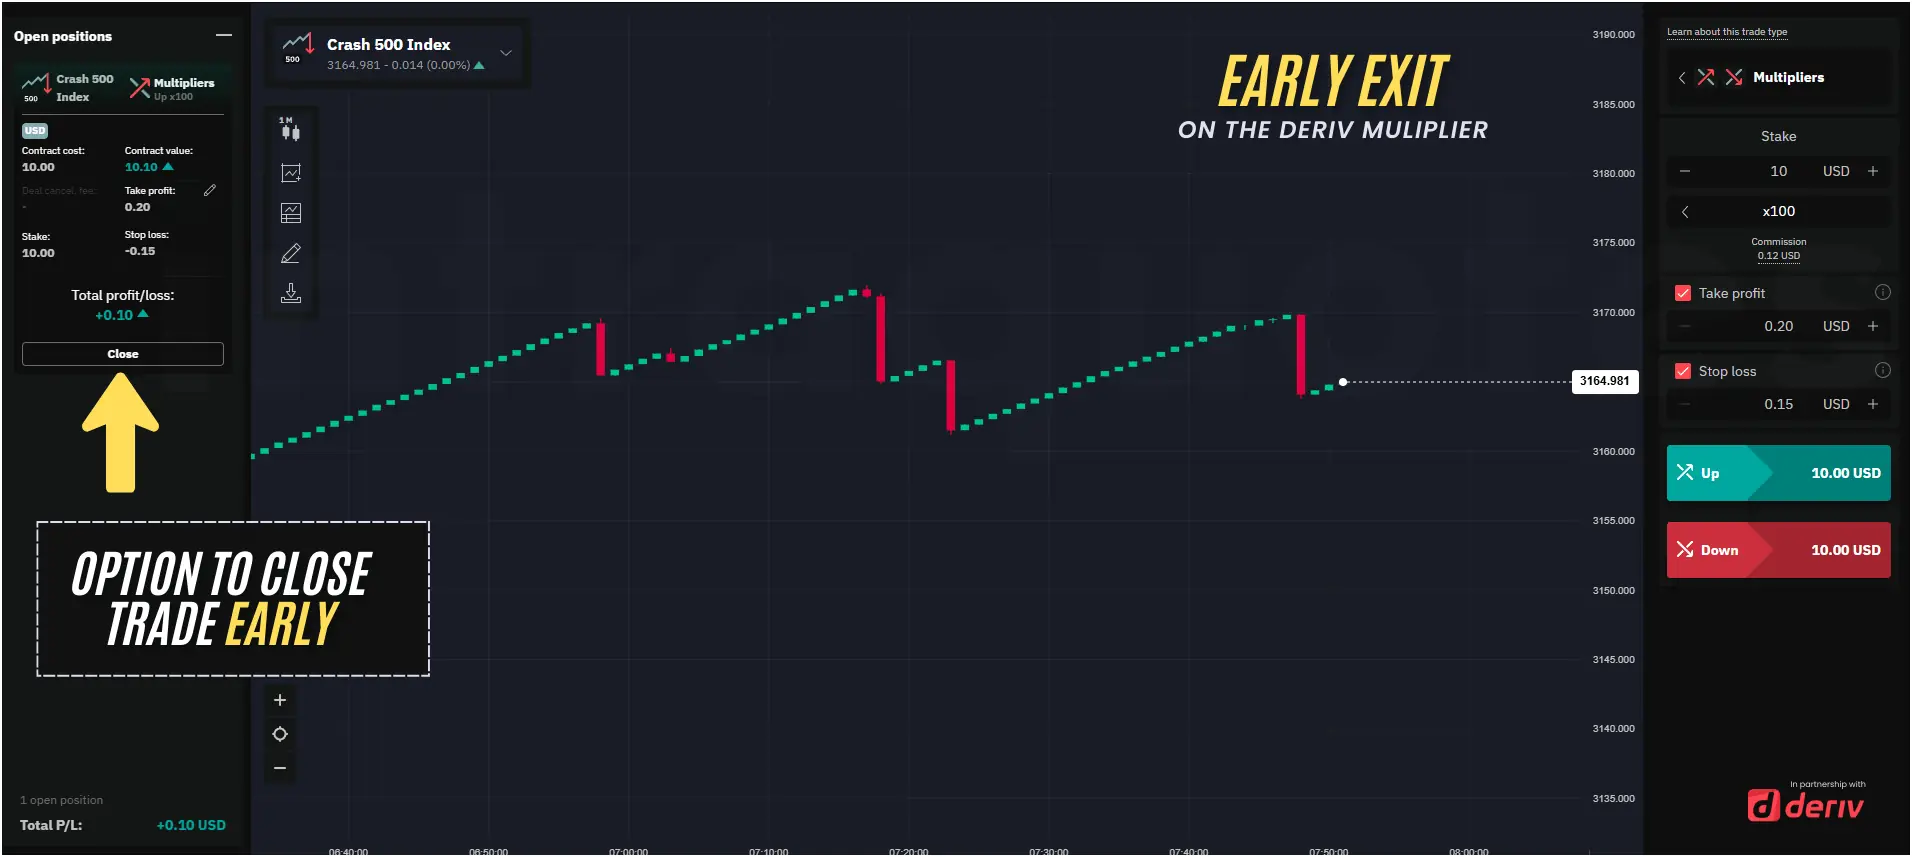
Deriv Multiplier offers an option to close the trade early. This is used by traders if they find any market situation that suggests an immediate trade exit to avoid financial loss. It is always better to sell the contract and take the profit, even if it’s a small one. A small win is always better than a big loss.
Note
Deriv Crash and Boom indices on a lower timeframe may look weird or clumsy, undecided, but if you zoom out to a bigger timeframe, the wave is always smooth. Therefore, long-term trades are safer only if you understand the trend properly and have done multiple time frame analyses properly. This is where the Hydra Trend Rider can make you profitable. Understanding the basics of price actions and the candlestick chart will take you that extra mile in trading with this strategy that others don’t even know about.
Stay ahead, trade smart. This is your chance to finally get closer to that dream of yours. Make it happen.