Forex Bonus

Forex Broker

Forex ECN Broker

Forex Copy Trading

Forex STP Broker

CFD Trading

Binary Options Broker

Forex

Binary Options

Options Trading

Day Trading Strategy

Metatrader

Forex Indicator

Trading Calculator

Market Analysis

Forex Cashback

LiteFinance Cashback

Roboforex Cashback

HFM Cashback

Marketvox Cashback


Mastering Binary Options Trading: OlympTrade

Introduction to Binary Options Trading

Binary options are a straightforward trading style where traders predict whether the market will go up or down within a specified period. With OlympTrade, a fixed 85% profit percentage awaits successful predictions across various market assets, including Forex, Indices, Stocks, and Cryptocurrency OTC Forex. Moreover, OlympTrade offers synthetic Indices for weekend trading.

Chart Setup for Precision Trading

To enhance trading precision, select the EUR/USD OTC market minute chart on OlympTrade, and choose the Japanese Candlestick Chart for a better view of market movements.

Indicators for Informed Decision-Making

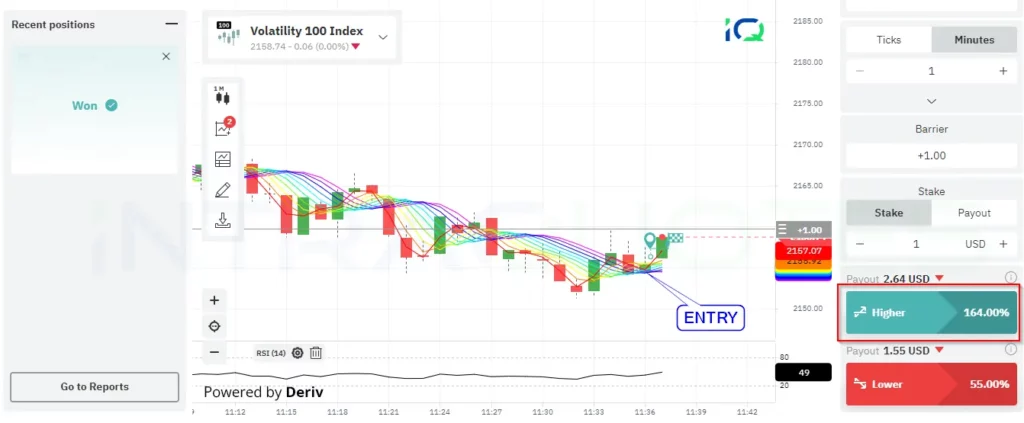
Take advantage of technical analysis tools by adding the default Ichimoku Cloud Indicator and RSI Oscillator from the Technical Analysis section

Effective Trading Strategy

For an ‘UP’ trade, wait for the candlestick to close above the bullish cloud, with the Tenkan and Kijun lines forming a new higher high. Make sure to notice RSI near or below 20, indicating an oversold condition. Conversely, for a ‘DOWN’ trade, look for the candlestick to close below the bearish cloud and the Tenkan and Kijun lines, creating a new lower low. Additionally, note that RSI is near or above 80, signaling an overbought condition.

Patterns to Watch and Trade Duration

Exercise caution with Symmetrical Triangle Figures, as they indicate indecision. Opt for Ascending and Descending Triangles and other reliable patterns like head and shoulder patterns. Trade durations can vary between 5 to 10 minutes based on market volatility.

Money Management Principles

Maintain a disciplined approach to money management. Avoid over-trading and adhere to a strict strategy. Winning three out of five trades with OlympTrade’s 85% return can still yield profits.

Trade Example Illustration

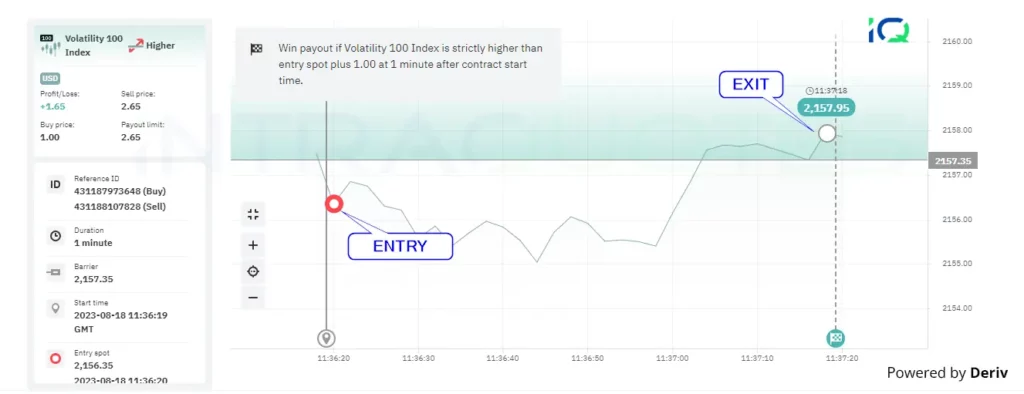
In a provided example, a bearish Ichimoku cloud and an overbought RSI situation indicated a potential downward market movement. By waiting for favorable conditions, entering the trade strategically, and exercising patience, the trade resulted in a profitable outcome.

Conclusion and Further Resources

Binary options trading with OlympTrade, employing the Ichimoku and RSI strategy, demands a thoughtful and strategic approach. Set alerts for specific trade signals, be mindful of market conditions, and always prioritize money management for sustained success.

Explore our Price Action series on YouTube for in-depth analysis insights into redefining your trading skills.

Boost Your Earnings with Ichimoku: Master Touch – No Touch Binary Options Strategy

Deriv Binary Options: The Power of Touch – No Touch Trading Strategy with Ichimoku

Discover an extraordinary path to profit through Deriv Binary Options’ Touch – No Touch trade type. This exceptional trading style empowers you to select specific price levels and predict whether the market will touch those thresholds.

Maximize your potential returns by embracing higher odds. Imagine capitalizing on an uptrend prediction where the market touches an intraday low. The odds are against it, making the chance slim, but the potential return soars – a remarkable 200%-300% on your bet.

Unveiling a unique trading opportunity, Deriv stands as the pioneer in this realm since 1999, providing an advanced web-based platform that supports such distinctive trading.

The Fundamental Trade Setup

Choosing the Barrier:

Opt for a barrier level in either the positive or negative range. For instance, if the market is quoting at $10 and you set the barrier at +1.25 with no touch, your no-touch threshold will be $11.25.

Trade Expiry Time:

In the chosen time span, victory comes if the market avoids reaching the $11.25 level. Select a time interval ranging from 5 ticks to a maximum of 365 days.

Stake or Payout:

Decide on the stake amount for investment per trade or opt for the payout amount to receive per trade as profit.

binary options Deriv touch no touch
BInary Options (Deriv): Touch No Touch trade setup
Instrument TypeDuration AvailableMinimum Duration
Forex, Commodity, Metals, IndicesDays1 days
Synthetic IndicesTick, Minute5 Ticks

The Strategy

Leveraging Ichimoku:

Japanese Ichimoku Kinko Hyo enables advanced technical analysis in a simple manner. The Ichimoku cloud visualization offers quick insights into market trends, proving invaluable for binary options touch no touch strategies.

The Ichimoku cloud, marked in green or red, holds the key. Green signals a bullish trend when the market floats above the green cloud, while red implies a bearish trend below the red cloud. This cloud is formed by Span A and Span B.

Confusion dissipates when you hover over the chart on Deriv, revealing indicator details.

For the Touch Strategy

Enter when the price bar or Japanese Candlestick closes above or below the Ichimoku cloud. Your touch target becomes the olive-colored line, the Chiku span line – a lagging span line. Refer to the example for clarity.

Deriv binary options trading with ichimoku cloud
Binary Options (Deriv) Touch trading strategy

For the No Touch Strategy

Enter when the price bar or Japanese Candlestick closes above or below the Ichimoku cloud. Your no-touch target lies at the Ichimoku cloud’s lower borderline for a bullish trend and at the upper borderline for a bearish trend. The image elucidates this process.

binary options Deriv ichimoku no touch strategy
Binary options (Deriv) No touch strategy

In the provided image, observe how a rising market invites a no-touch trade with the target set at the Ichimoku cloud’s lower borderline. The strong uptrend implies fewer chances of receding within the cloud and crossing below it.

In Conclusion

Success with this strategy hinges on comprehending Ichimoku indicators that validate bullish and bearish trends. The rest unfolds seamlessly. Approach cautiously by practicing with smaller trade sizes or testing on a demo account for secure trading. Elevate your binary options trading with Ichimoku’s wisdom.

deriv cryptocurrency trading free ebook

Trade the above strategy with Deriv

Get Free Crypto E-Book

Disclaimer: Deriv offers complex derivatives, such as options and contracts for difference (“CFDs”). These products may not be suitable for all clients, and trading them puts you at risk. Please make sure that you understand the following risks before trading Deriv products: a) you may lose some or all of the money you invest in the trade, b) if your trade involves currency conversion, exchange rates will affect your profit and loss. You should never trade with borrowed money or with money that you cannot afford to lose.

Trading Higher Lower Binary Options – Deriv

Ad Space Available

Ad Space Available

Binary Options: The Power of Trading Higher and Lower

Binary options higher-lower trade offers significant profit potential through strategic approaches. Achieve returns from 23% to 350%, yet this method hinges on market volatility. Explore trade duration, barrier setup, and effective trading strategies.

Trade Duration and Barrier Setup

Choose between fixed expiry or time-based durations: ticks, seconds, minutes, hours, or days. Set barriers using positive or negative values. A “+” before the barrier means a value above the current price, while a “-” indicates below. For instance, with a barrier of +2.39 and a current price of 7130.10, opting for “higher” necessitates the market to remain between 7130.10 and 7102.39 during the trade.

Binary options higher lower trade
Binary Options Higher Lower Trade: Example 1

Symbol Selection and Strategy

Opt for highly volatile symbols. Avoid tick trades for higher-lower options. Implement an RSI (Relative Strength Index) oscillator for momentum analysis. Trade higher or lower only when RSI crosses above 50, adjusting barriers for better-winning odds. Analyze trends using indicators like rainbow moving averages.

Binary options changing symbol
Binary Options: Changing Symbols on Chart

Example: A Winning Trade

To trade higher & lower, you need to choose symbols that are highly volatile.

In the example below we have used 1 minute chart for 1 minute duration. Will not recommend using tick trade for the higher and lower types of Deriv binary trade.

For checking momentum we have added an oscillator indicator, RSI (Relative Strength Index) on the chart. We will be placed in higher or lower trade only when RSI will be at or crossing above 50. Always adjust the barrier to a lower value, so that the winning rate can increase. Also in order to understand the trend bullish or bearish, always use a trend indicator and study price action. In this example, we have added rainbow moving averages for determining trends.

binary options trading strategy higher lower
Binary Options Trading on 1 Minute Chart

Utilizing a 1-minute chart and RSI for momentum, we confirmed a bullish trend via rainbow moving averages. Placing a higher trade with a +1.00 barrier yielded a remarkable 164% ROI.

binary options trading strategy
Binary Options Trade Graph

Money management – Ending Notes:

Succeed with a fixed trade amount and steer clear of attempting recovery through unbalanced lot sizes. Explore comprehensive money management strategies to optimize your success potential.

Unlock the potential of higher-lower binary options trading. Boost profits, manage risks, and master winning strategies for sustained success.

🔗Related Link

Why you should risk ONLY 2% | Learn more about effective money management strategies!

deriv cryptocurrency trading free trading ebook download

LEARN FOREX

FREE COURSE

15 chapters to begin with

Begin

Ad Space Available

Bollinger Bands + MACD: The Ultimate Guide for Binary Options Traders

Bollinger bands are a standard tool for binary options trading. They tremendously assist traders to identify both trending and ranging markets at a glance. They are also easy to use and interpret. In this article, we will explain three strategies that anyone can apply to any given time frame, using oscillator as an additional indicator. Oscillators are helpful for binary options trading as they can indicate when the market is overbought or oversold, which can give a possible reversal sign. By combining Bollinger bands with oscillators, you can boost your binary options trading strategy and increase your success rate.

Basics of Bollinger Bands

Bollinger bands are a technical analysis tool that display a channel with a middle band, which indicates the volatility of the market. The middle band acts as a reference point for the market sentiment. If the price is above this middle band, then the market is bullish, and if it is below the band, then the market is bearish.

Usage of Oscillators

Oscillators are another technical analysis tool that can assist traders to identify market trends and signals. One of the most popular oscillators is MACD (Moving Average Convergence Divergence), which we will use in this example. MACD shows two types of signals: MACD signal and MACD trend. We only need to pay attention to the MACD signal that concur with the Bollinger band signal.

Using Bollinger bands and MACD together, we can create a binary options trading strategy that can help us gain financially from market fluctuations. Binary options are a type of financial instrument that allow traders to bet on the direction of the price movement of an asset, such as forex, stocks, commodities, etc. Binary options trading is a simple and quick way to make money online, but it also involves high risks and ask for careful analysis and planning.

1. Bullish Breakout

In binary options trading, a bullish breakout is recognized when the market price, represented as a candlestick or bar, closes above the upper Bollinger band on the chart. This occurrence acts as a signal to place a call order or buy order. The trading duration will vary based on the chosen time frame for analysis using technical indicators like MACD and oscillators.

bollinger band macd moving average convergence and divergence analysis for binary options in uptrend
Uptrend Analysis

To illustrate, consider the example of AUDUSD (Australian Dollar/US Dollar) on 15 minutes chart. The Bollinger band displays a bullish breakout signal, complemented by a bullish signal from the MACD.

As long as candlesticks consistently close above the upper Bollinger band, the market indicates a bullish trend. However, a weakening in the bullish trend is indicated when the bar closes below the upper Bollinger band and the MACD displays a bearish signal. Utilizing such technical analysis can help refine and optimize a binary options trading strategy.

Quick Tip:

MACD can filter many false signals as shown in the picture, where Japanese candlesticks closed below Bollinger upper band but MACD was still bullish.

2. Bearish Breakout

In binary options trading, a bearish breakout is identified when the market price, represented as a candlestick or bar, closes below the lower Bollinger band on the chart. This occurrence serves as a signal to place a put order or fall order. The trading duration will vary depending on the chosen time frame for analysis using technical indicators like MACD and oscillators.

Bollinger band binary options trading strategy
Bearish Trend

To illustrate, consider the example of the GBPUSD (Pound/US Dollar) of hourly chart. The Bollinger band displays a bullish breakout signal, complemented by a bullish signal from the MACD.

3. Range Market

In binary options trading, a range market is identified when the market price, represented as a candlestick or bar, stays inside both the upper and lower Bollinger band and the band channel keeps squeezing on the chart. This occurrence signals to place a stay-in-range order within a selected time range.

Trade binary options range breakout
Range Market

To illustrate, consider the example of USDJPY (US Dollar/Yen) of 5 minutes chart. The Bollinger band displays a range market, complemented by a no-trend signal from the MACD. At this point, stays binary order has a better chance to win.

deriv cryptocurrency trading free ebook

Trade the above strategy with Deriv

Get Free Crypto E-Book

Disclaimer: Deriv offers complex derivatives, such as options and contracts for difference (“CFDs”). These products may not be suitable for all clients, and trading them puts you at risk. Please make sure that you understand the following risks before trading Deriv products: a) you may lose some or all of the money you invest in the trade, b) if your trade involves currency conversion, exchange rates will affect your profit and loss. You should never trade with borrowed money or with money that you cannot afford to lose.

error: Content is protected !!